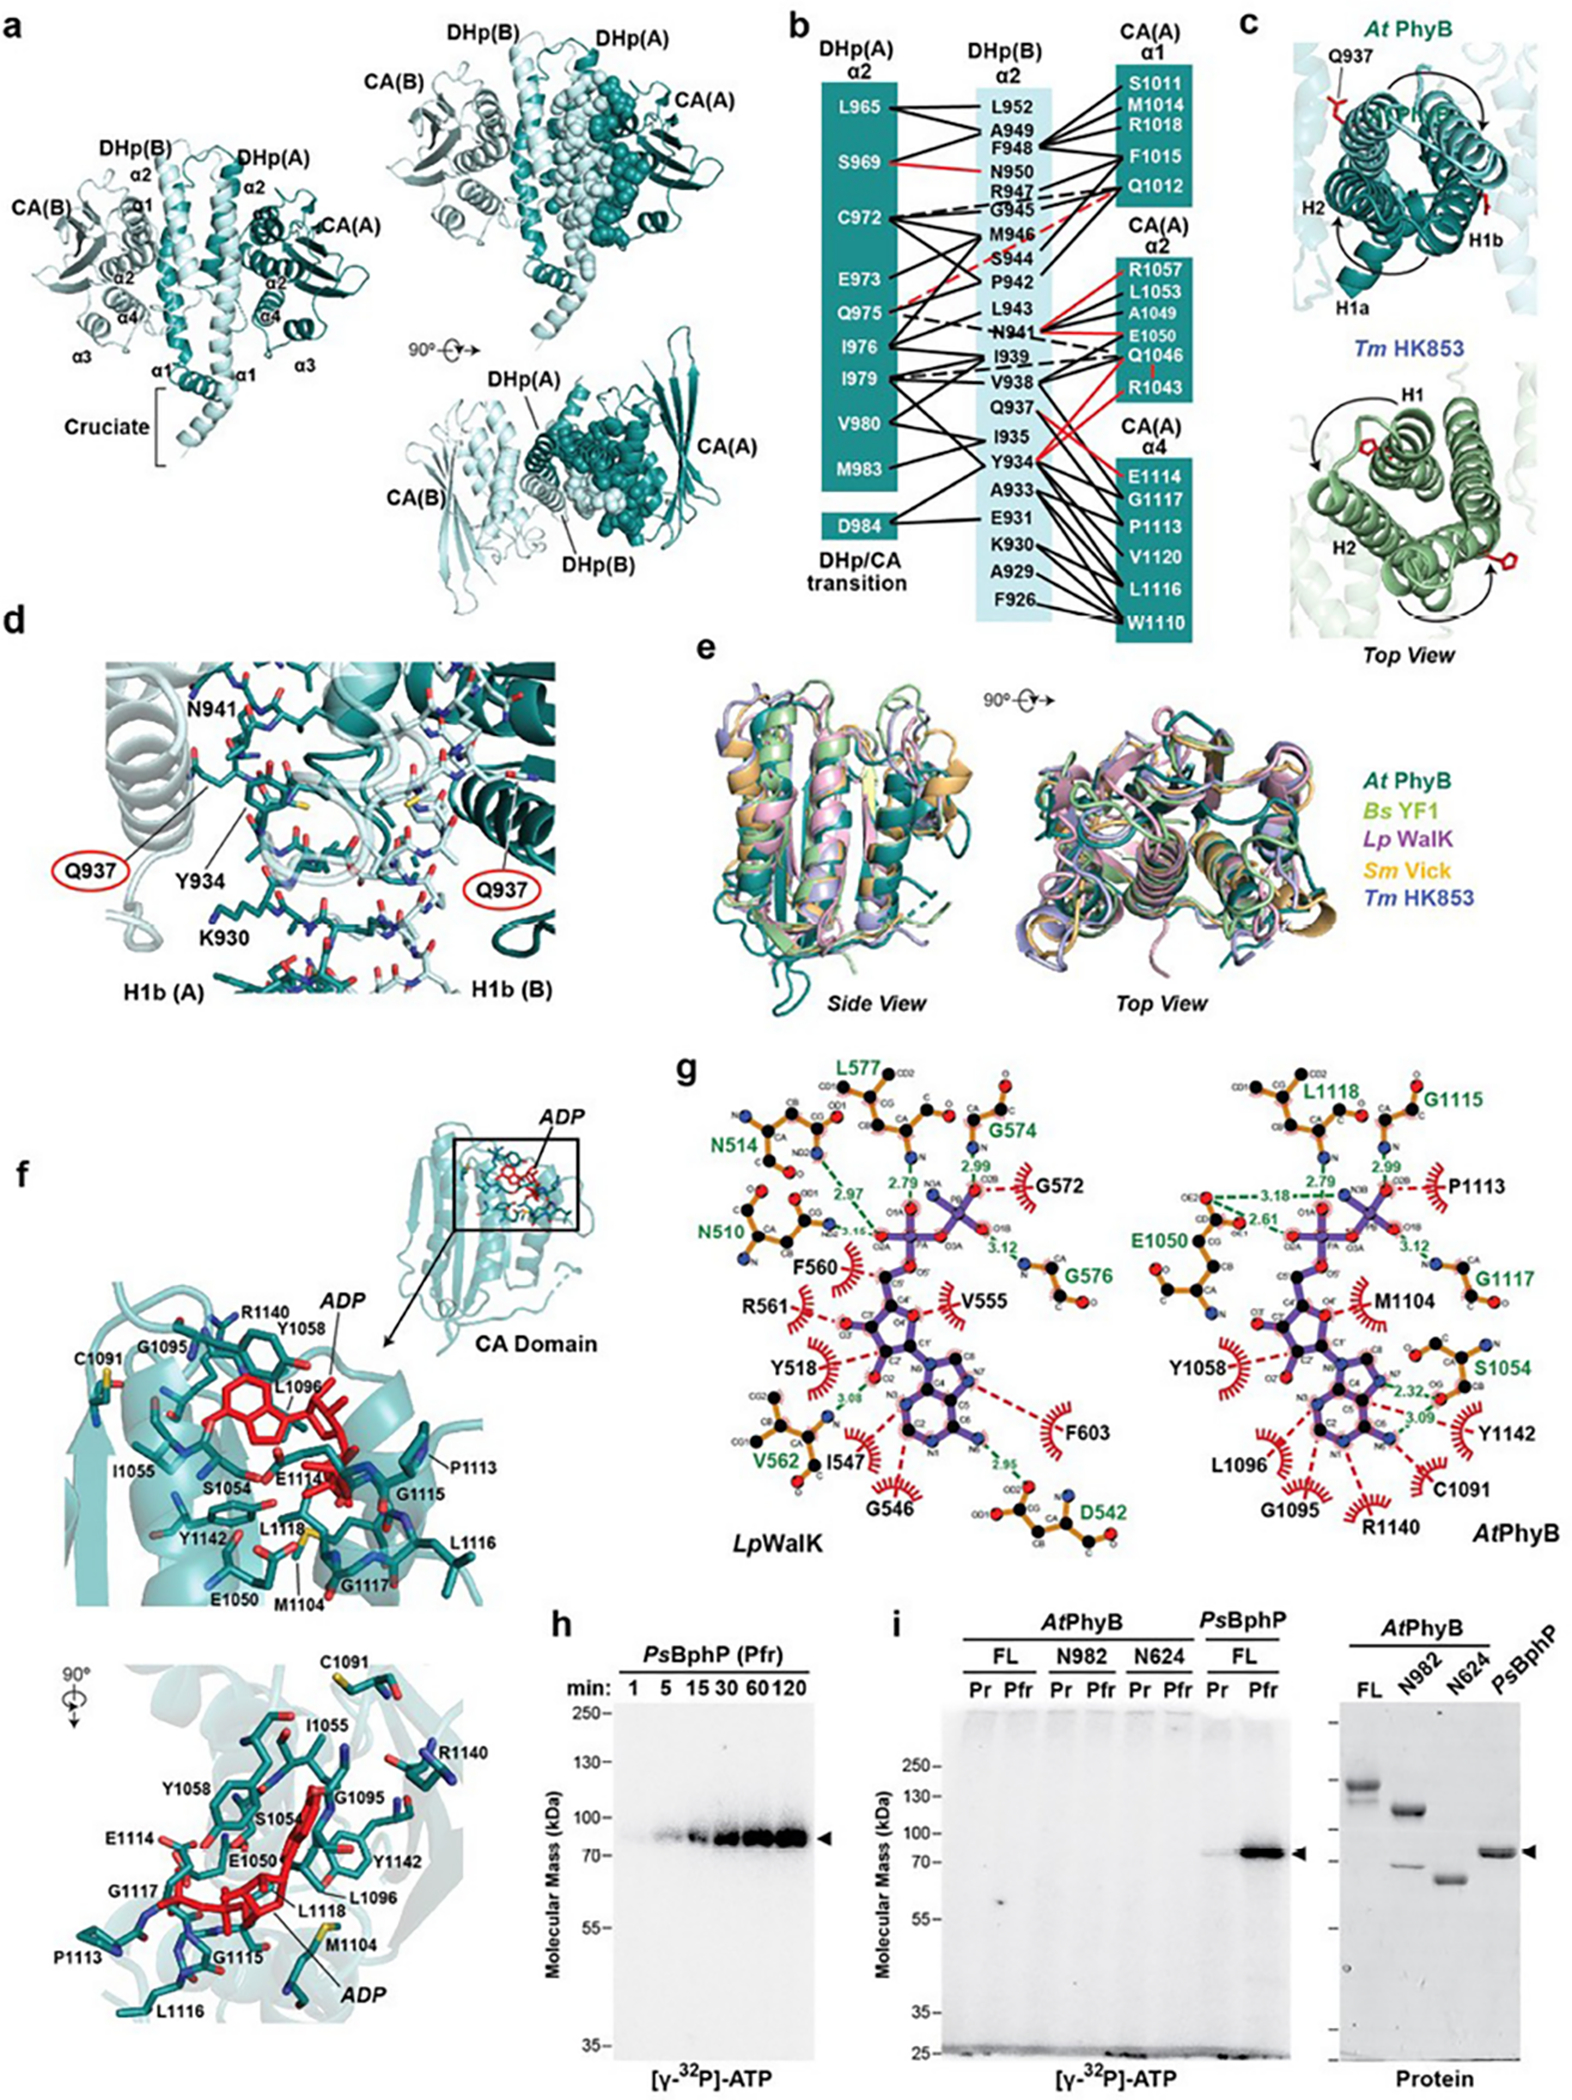
Extended Data Fig. 7 |. Structural and enzymatic analyses of PhyB reveal its homology to transmitter HKs but with a compromised phosphotransferase activity.

a, Cartoon 3D structure of the paired HKRDs from Arabidopsis (At) PhyB showing the structures and inter-molecular interfaces between the CA and DHp domains. Images on the right show a pair of orthlogonal views with residues within one half of the HKRD dimer interface shown as spheres. These residues were contributed by helix α1 from the DHp of protomer B, and helix α2 of DHp and helices α1, α2 and α4 from the CA domain of protomer A. b, The network of intermolecular contacts between the DHp and CA domains in (a) illustrated for simplicity. c, Top views of the DHp regions of the HKRDs for At PhyB as compared to the same region in the prokaryotic HK853 transmitter HK from Thermotoga maritima (PDB ID 3DGE37). Gln937 in At PhyB and the phosphoacceptor histidine in Tm HK853 are shown in red sticks. d, Closeup 3D views of the DHp domains in At PhyB corresponding to the region surrounding phosphoacceptor histidine in transmitter HKs. Gln937 in PhyB, which is a histidine in transmitter kinases, is circled. e, 3D superposition of the CA domain in At PhyB shown in cartoon with those from several bacterial two-component HKs illustrating its HK ancestry. Representatives include YF1 from Bacillus subtilis (Bs) (PDB ID 4GCZ), WalK from Lactobacillis plantarum (Lp) (PDB ID 4U7O), HK853 from Thermotoga maritima (Tm) (PDB ID 3DGE), and Vick from Streptococcus mutans (Sm) (PDB ID 4I5S). f, Model showing the predicted position of ADP (red) in the AtPhyB CA domain when modeled after that for LpWalK. Residues that might participate in binding are indicated. ADP clashes with multiple residues in the pocket of this predicted AtPhyB model, suggesting that conformational shifts in AtPhyB induced by ATP or upon photoactivation would be necessary for binding. g, Schematic of binding interactions between the ADP analogue adenylyl-imidodiphosphate (AMPPNP) and CA domain from the Lp WalK determined by X-ray crystallography (left; PDB ID 4U7O36) and that predicted for AtPhyB when modelled after the LpWalK structure (right). Hydrogen bonds and representative hydrophobic interactions are indicated with green and red dashed lines, respectively. Analogous residues are depicted in similar positions in schematics, except for LpAsn514 and AtSer1054. h and i, AtPhyB is a poor protein kinase as compared to Pseudomonas syringae (Ps) BphP based on autophosphorylation assays. The recombinant biliproteins were incubated at ambient temperature (~24°C) with 150 μM ATP supplemented with 10 μCi of [γ-32P]-ATP, quenched with SDS-PAGE sample buffer, and subjected to SDS-PAGE. Shown are the SDS-PAGE gels assayed for bound 32P by autoradiography or stained for protein with Coomassie blue. h, Time course for autophosphorylation of PsBphP as Pfr. i, Comparisons of autophosphorylation activities of AtPhyB as Pr and Pfr with those of PsBphP. Reactions containing equal mass amounts of biliprotein were terminated after 2 hr. (left) Autoradiography of the kinase reactions. (right) SDS-PAGE gel showing the biliprotein preparations used. Arrowheads locate PsBphP. The phosporimager scans are representative of 3 independent experiments. Full gels can be found in Supplementary Fig. 1.
