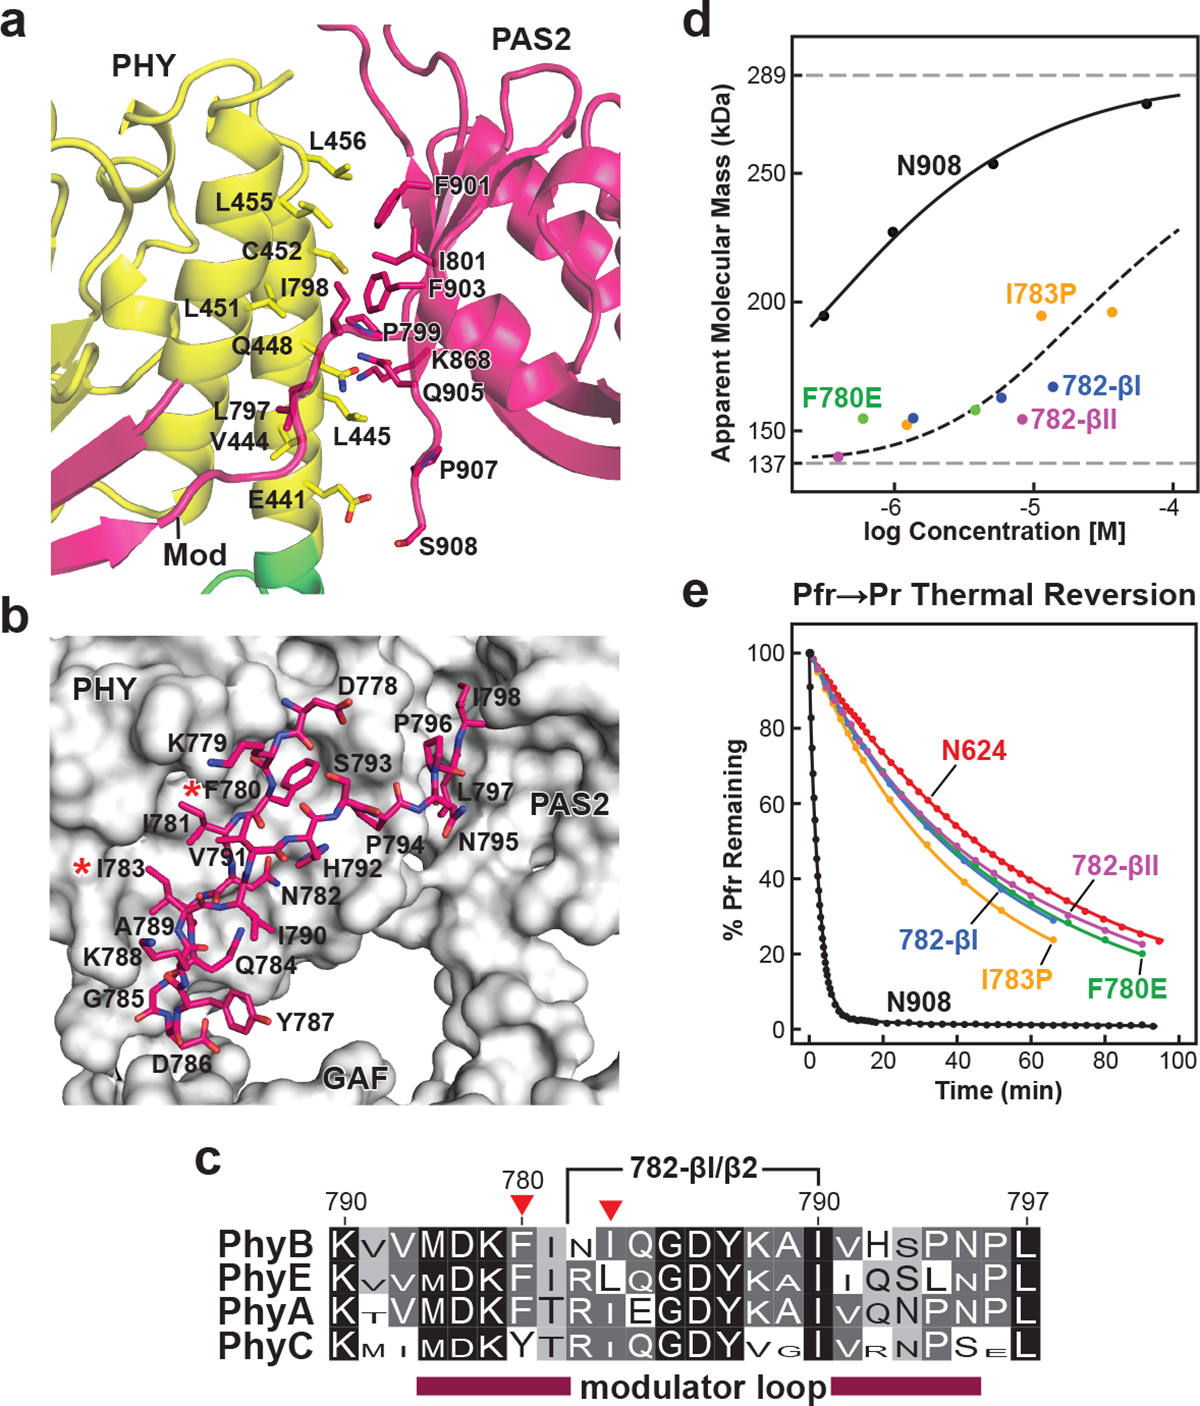
Fig. 4 |. Interactions between the modulator loop and the PAS2 and PHY domains within each protomer stabilize PhyB dimerization but destabilize Pfr.

a, Cartoon view of the intraprotomer hydrophobic interface between the PHY and PAS2 domains. Interface residues are shown as sticks and are labelled. b, Close-up stick view of the modulator loop together with a grey surface view of the GAF, PHY and PAS2 domains of its protomer. The red asterisks highlight the point mutations tested in d and e. c, Amino acid sequence conservation of the modulator loop among angiosperm Phy photoreceptors. Identical and similar amino acids are shown in black and grey boxes, respectively, the font height of which is proportional to its percentage identity within each subfamily. The red arrowheads locate Phe780 and Ile783. The region replaced in the 782-β1 and 782-β2 turn mutants is indicated. d, SEC analysis of modulator loop mutants in the N908 polypeptide as a function of protein concentration, demonstrating the importance of the feature to PhyB dimer stability. The modulator loop was shortened by replacing residues 782–790 (NIQGDYKAI) with type I (NPDG) and type II β turns (NPGR). Individual data points are shown with the best fit line. The dashed grey lines show the calculated molecular mass of the N908 fragment at low and high protein concentrations; the dashed black line collectively shows the trend for all modulator mutants. e, Weakening the modulator loop–PHY contact slows Pfr to Pr thermal reversion. Preparations described in d were photoconverted to Pfr and allowed to revert back to Pr in darkness at 25 °C. The N624 truncation was included for comparison. Normalized data points and fit lines from reactions representative of three technical replicates are shown for reversion measurements at 725 nm (see Extended Data Table 3 for rate constant and s.d. values). The exact location of the mutations, SDS–PAGE analysis, and Pr and Pfr absorption spectra of the mutant biliproteins are shown in Extended Data Figs. 6 and 8.
