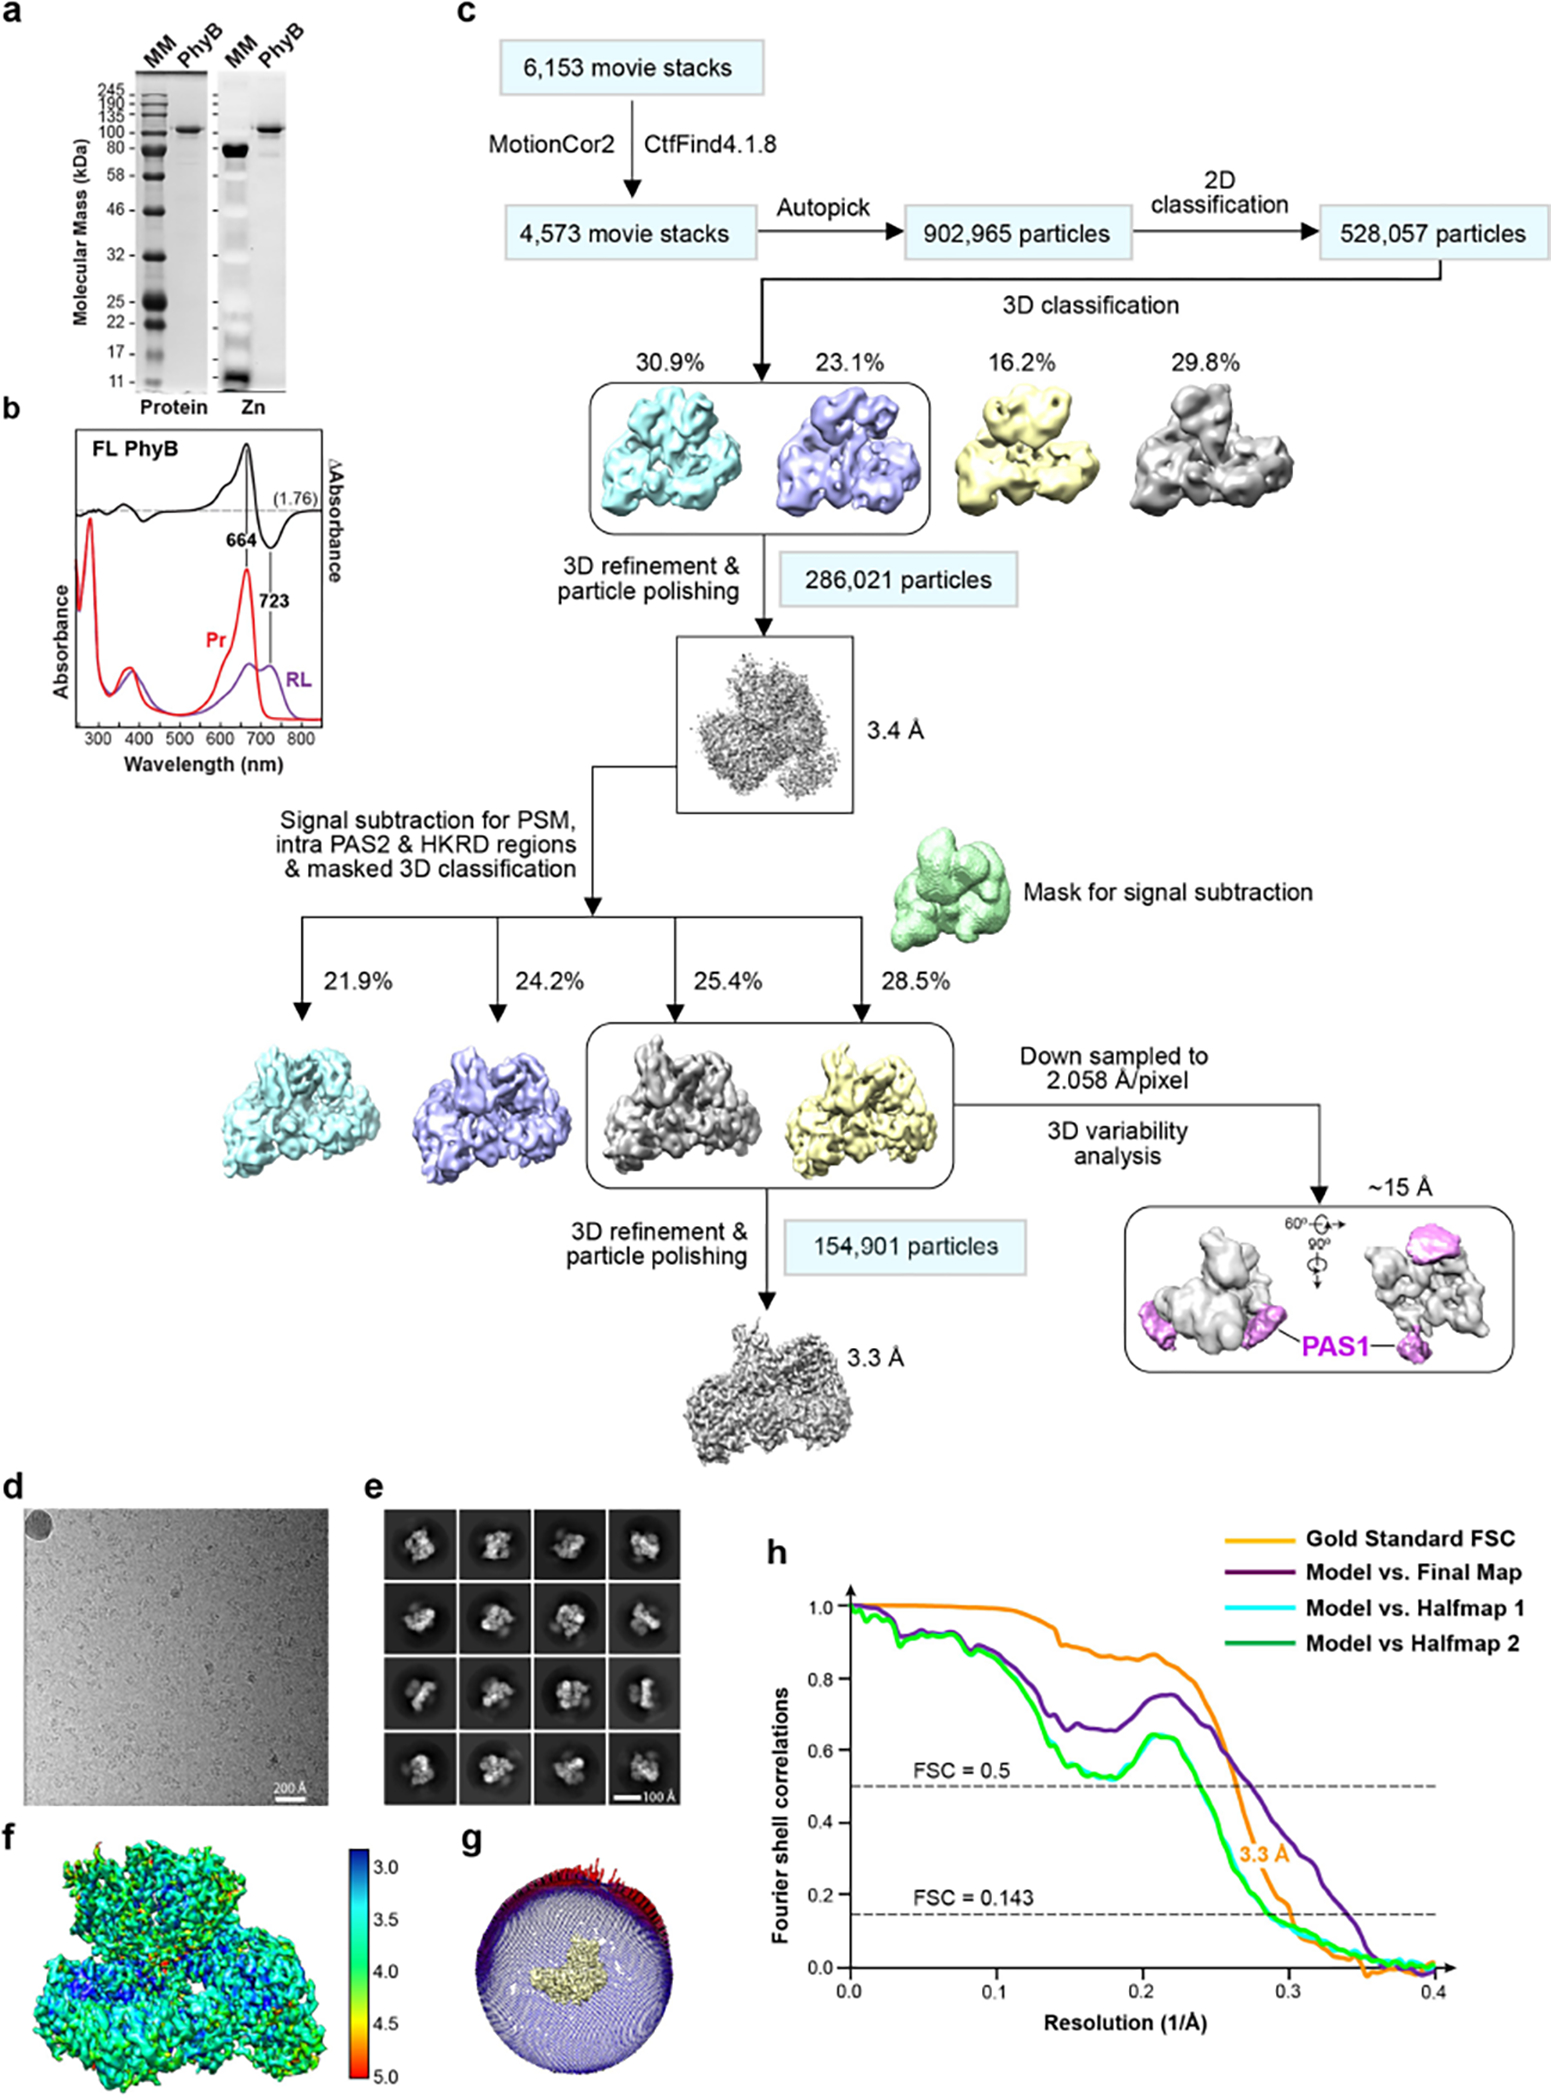
Extended Data Fig. 1 |. Workflow and resolution estimation for the cryo-EM map of Arabidopsis PhyB.

a, SDS-PAGE analysis of the recombinant full-length biliprotein. Gels were either stained for protein with Coomassie blue (left) or assayed for bound PΦB by zinc-induced fluorescence (right). MM, molecular mass standards. Samples were indistinguishable to those described by Burgie et al.2 b, UV-vis absorbance spectra of PhyB. The spectra were collected from dark-adapted samples (Pr) or after saturating irradiation with 660-nm red light (RL, mostly Pfr). Absorption maxima were determined from the difference spectrum shown at 70% amplitude. The spectral change ratio (SCR)8 at 723 nm is indicated in parenthesis. c, Work flow for data processing of the cryo-EM images of the PhyB dimer. In the first refined overall map at 3.4-Å resolution, all PhyB domains were present but the regions encompassing the PAS1 domain were poorly resolved. Focused refinement, excluding the PAS1 domains, led to the 3.3-Å final map (lower left panel). Lower right panel shows that the EM density of the flexible PAS1 domains (purple), which were captured at 15-Å resolution by 3D variability analysis of down-sampled particle images. d–h, Resolution estimation of the 3.3-Å 3D map. d, A representative cryo-EM micrograph sampled from 6,153 micrographs collected. e, Sampling of 2D class averages. f, Colored-coded local resolution of the 3D map. g, Eulerian angle distribution of raw particle images used in the final 3D reconstruction. h, Gold-standard Fourier shell correlation (FSC) and the validation of the atomic model by correlation curves comparing the model to the final and two half maps.
