. 2020 Dec 11;21(2):365–377. doi: 10.1039/d0lc00672f

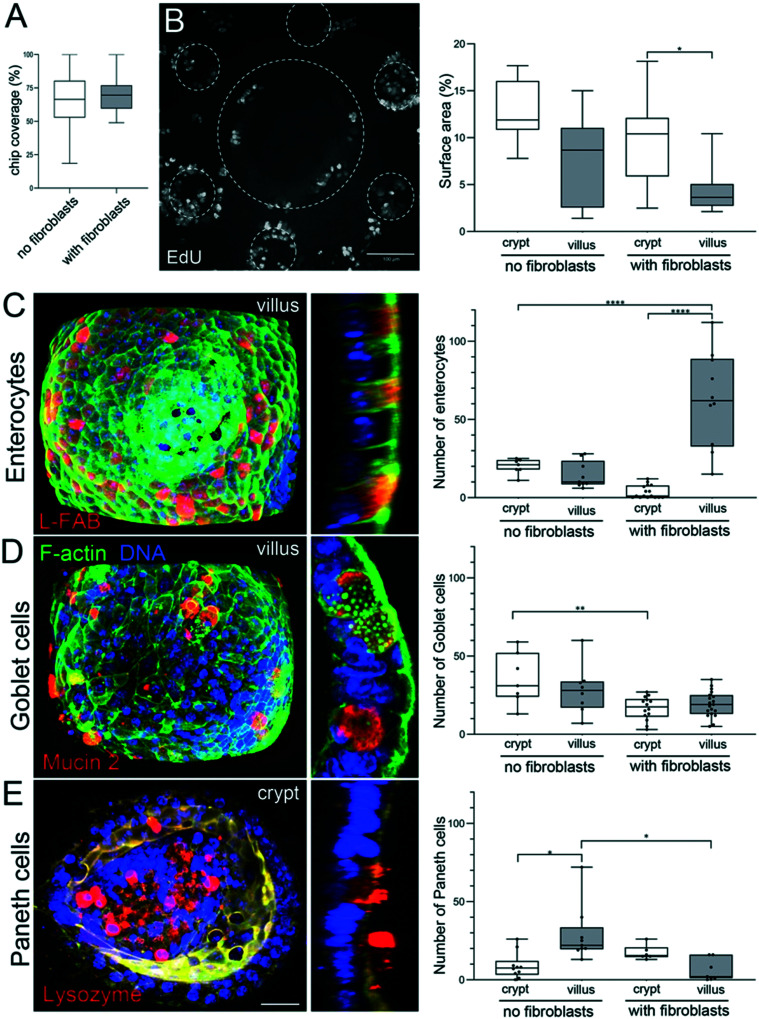
Fig. 5. Segregation of proliferative and differentiated cells. A. Percentage of the chip covered with epithelial cells 14 days after seeding the organoids on collagen scaffolds, in the absence or presence of fibroblasts. n = 128 units, N = 3 independent experiments. Mean ± SEM, t-test **, p < 0.001; *, p < 0.05. B. Left: Dividing (EdU positive cells) in the monolayer of epithelial cells stained 14 days after seeding the organoids over the collagen scaffold containing fibroblasts with fluid shear stress. Top view, maximal projection of 493 μm. Scale bar, 100 μm. Right: Percentage of the surface area (2D maximal projection) occupied with dividing, EdU positive cells, in crypts and villi, in the absence or presence of fibroblasts. n = 10 units (unit: 1 villi surrounded by 6 crypts), N = 3. Mean ± SEM, t-test **, p < 0.001; *, p < 0.05. C. Left: Fully differentiated enterocytes labeled with anti-L-FABP antibodies (red) in the epithelial monolayer 14 days after seeding the organoids over the scaffold containing primary mouse intestinal fibroblasts with continuous fluid shear stress. F-Actin (green), DNA (DAPI, blue). Left panel, maximal projection of 95 μm from the top of the villus. Scale bar 20 μm. Right panel, a cross-section through the villus. Right: The number of enterocytes in crypts and villi, in the absence or presence of fibroblasts. n = 12 units, N = 2. Mean ± SEM, t-test **, p < 0.001; *, p < 0.05. D. Left: Fully differentiated goblet cells labeled with anti-mucin2 antibodies (red) in the epithelial monolayer 14 days after seeding the organoids over the scaffold containing primary mouse intestinal fibroblasts with continuous fluid shear stress. F-Actin (green), DNA (DAPI, blue). Left panel, maximal projection of 95 μm from the top of the villus. Scale bar 20 μm. Right panel, a cross-section through the villus. Right: The number of goblet cells in crypts and villi, in the absence or presence of fibroblasts. n = 15 units, N = 2. Mean ± SEM, t-test **, p < 0.001; *, p < 0.05. E. Left: Fully differentiated Paneth cells labeled with anti-lysozyme antibodies (red) in the epithelial monolayer 14 days after seeding the organoids over the scaffold containing primary mouse intestinal fibroblasts with continuous fluid shear stress. F-Actin (green), DNA (DAPI, blue). Left panel, maximal projection of 55 μm from the bottom of the crypt. Scale bar 20 μm. Right panel, a cross-section through the crypt. Right: The number of Paneth cells in crypts and villi, in the absence or presence of fibroblasts. n = 10 units, N = 2. Mean ± SEM, t-test **, p < 0.001; *, p < 0.05.

Fig. 5