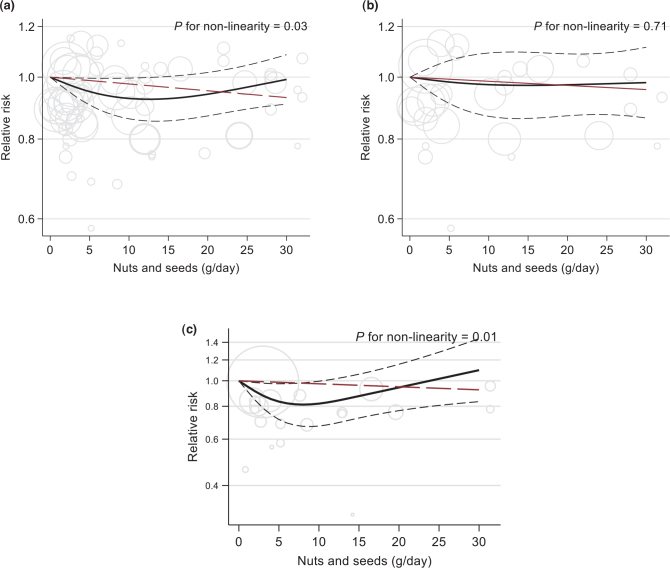
Fig. 7.
Linear (red, dashed line) and non-linear dose-response (black lines with confidence intervals) association between total nuts and seeds consumption and risk of total stroke (panel A; 11 studies), ischaemic stroke (panel B; 8 studies) and stroke mortality (panel C; 6 studies) in cohort studies, with 0 g/day as reference. Circles show the effect estimates for each level of intake in the individual studies, weighted by the inverse of the standard errors. Vertical axes are log scaled.

