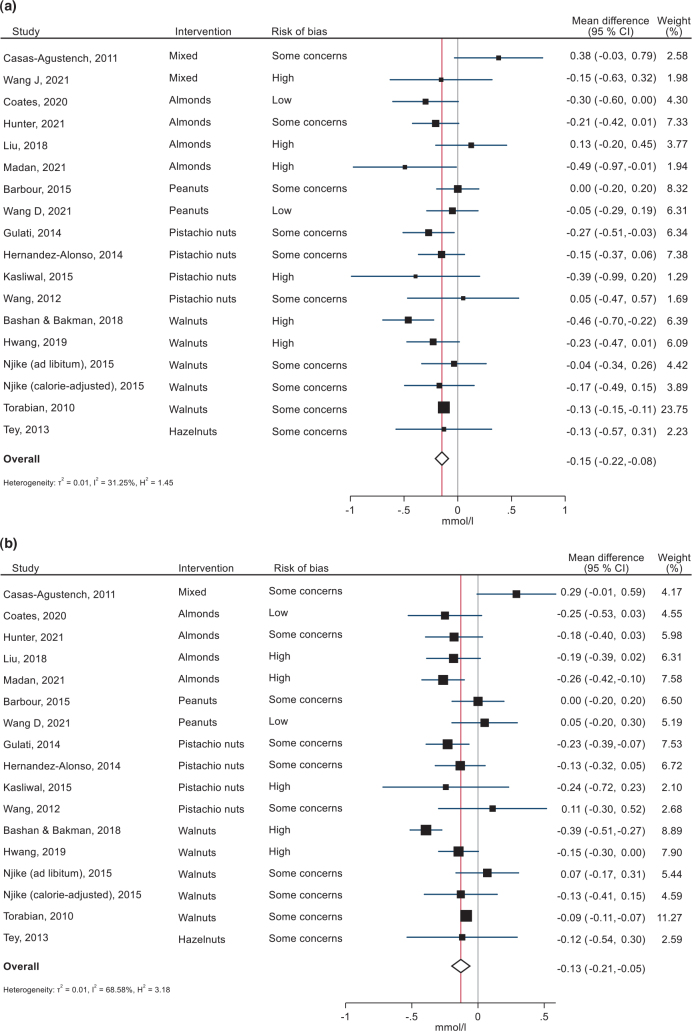
Fig. 10.
Forest plots of the effects of nut consumption on total cholesterol (A) and LDL-cholesterol (B) in randomized controlled trials, sorted by type of nut intervention. Effect sizes are weighted mean differences with 95% confidence intervals, in mmol/L. Analyses were performed with random-effects restricted maximum likelihood models.

