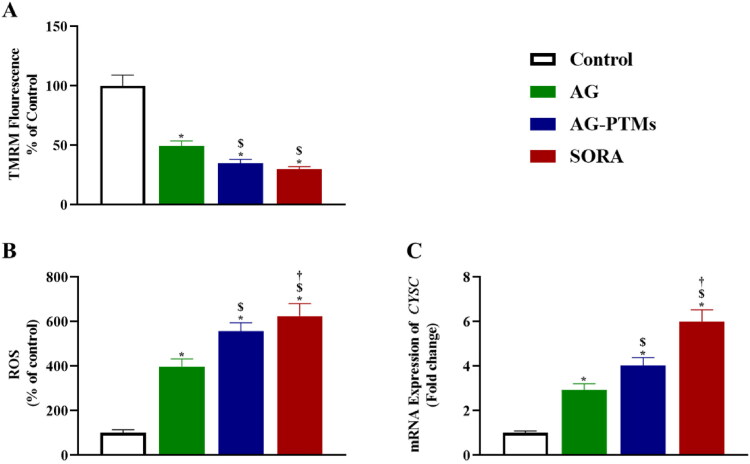
Figure 9.
Graphic presentation of changes in MMP (A), ROS production (B) and mRNA expression of CYSC (C) in HepG2 cells pretreated with AG, AG-PTMs, and SORA. Data are represented as mean of six independent experiments ± SD. *Statistically significant differences from control at p < .05, $statistically significant differences from AG at p < .05, †statistically significant differences from AG-PTMs at p < .05.

