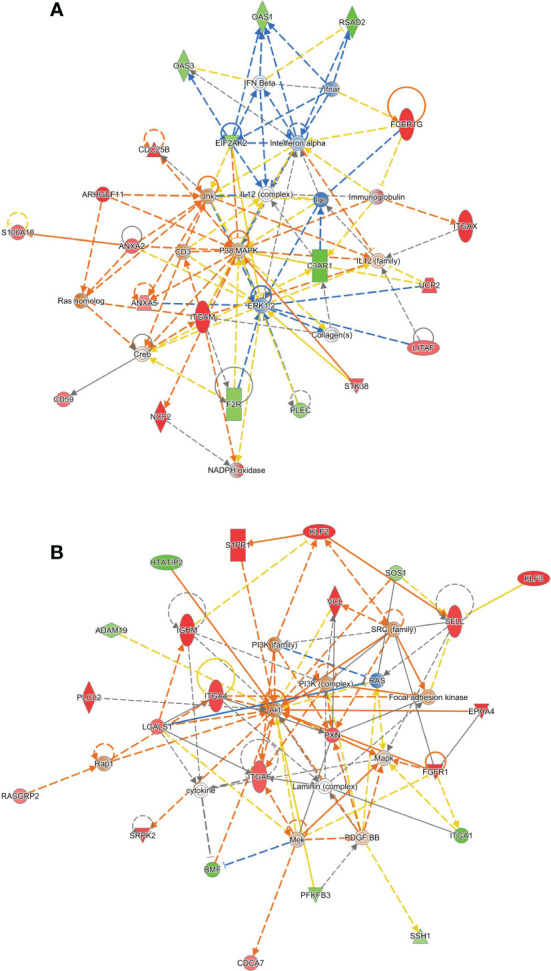
Figure 5.

Ingenuity Pathways Analysis identifies two gene networks altered in HTATIP2 knockdown. Primary CD4+ T cells were obtained from three donors and transfected with non-targeting siRNA or an siRNA pool against HTATIP2. A paired differential gene expression analysis was used to identify changes in expression. (A) A network centered on a hub of MAP kinase signaling. Genes shown in green are downregulated; gene shown in red are upregulated. Solid lines are direct connections; dashed lines are indirect connections. (B) A network centered on PI3 kinase/AKT and cell adhesion/migration.
