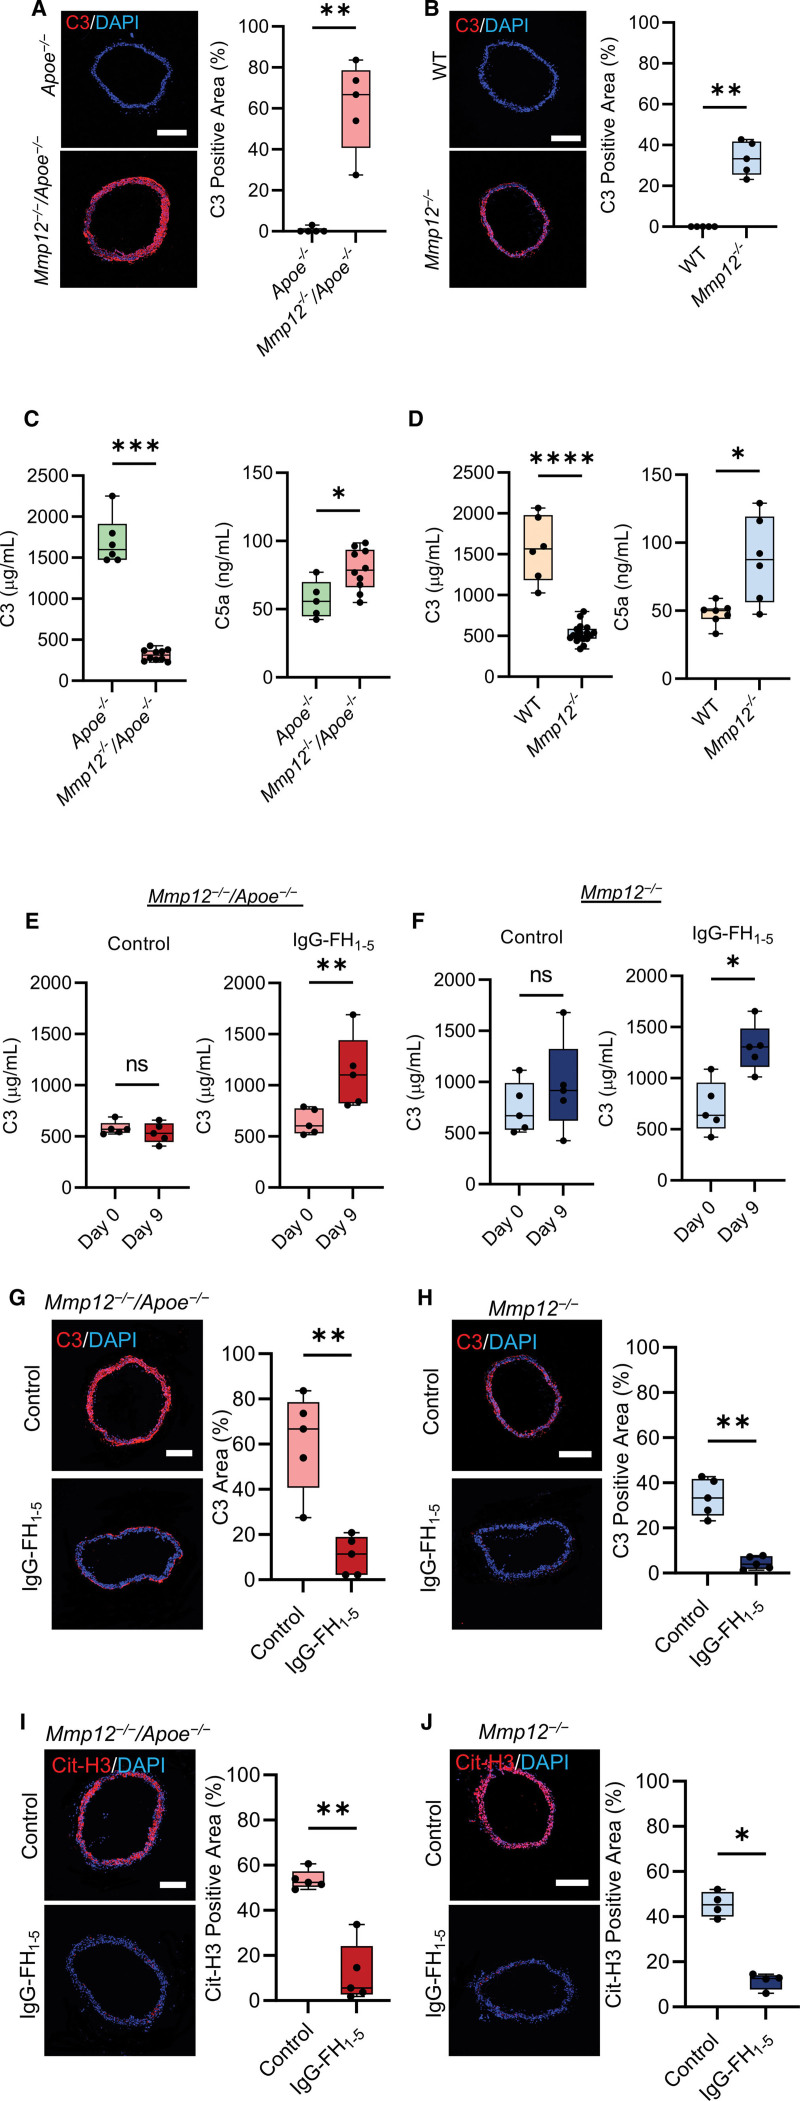
Figure 4.
Effect of Mmp12 deletion on aortic wall complement deposition. A and B, Representative images of immunofluorescence staining and quantification of C3 deposits (red) in suprarenal abdominal aorta of Apoe-/- and Mmp12-/-/Apoe-/- (A), and WT and Mmp12-/- (B) mice. Nuclei are stained with DAPI in blue. n=5 per group. Scale bar: 500 µm. C and D, Plasma C3 and C5a levels of Apoe-/- and Mmp12-/-/Apoe-/- (C), and WT and Mmp12-/- (D) mice. n=5 to 10 per group. E and F, Plasma C3 levels in Mmp12-/-/Apoe-/- (E) and Mmp12-/- (F) mice at baseline and 9 days of treatment with IgG-FH1-5 (factor H-immunoglobulin G) or MOPC antibody (control). n=5 per group. G and H, Representative images of immunofluorescence staining and quantification of C3 (red) in suprarenal abdominal aorta of Mmp12-/-/Apoe-/- (G) and Mmp12-/- (H) mice after 9 days of treatment with IgG-FH1-5 or MOPC antibody (control). n=5 per group; Scale bar: 500 µm. I and J, Representative images of immunofluorescence staining and quantification of Cit-H3 (red) in suprarenal abdominal aorta of Mmp12-/-/Apoe-/- (I) and Mmp12-/- (J) mice after 9 days of treatment with IgG-FH1-5 or MOPC antibody (control). n=4 to 5 per group. Scale bar: 500 µm. *P<0.05, **P<0.01, ****P<1x10-4 by 2-tailed Mann-Whitney U test (A through J). Cit-H3 indicates citrullinated histone H3; C3, complement component 3; C5a, complement component 5a; DAPI, 4′,6-diamidino-2-phenylindole; IgG-FH1-5, factor H-immunoglobulin G; MMP, matrix metalloprotease; and WT, wild-type.

