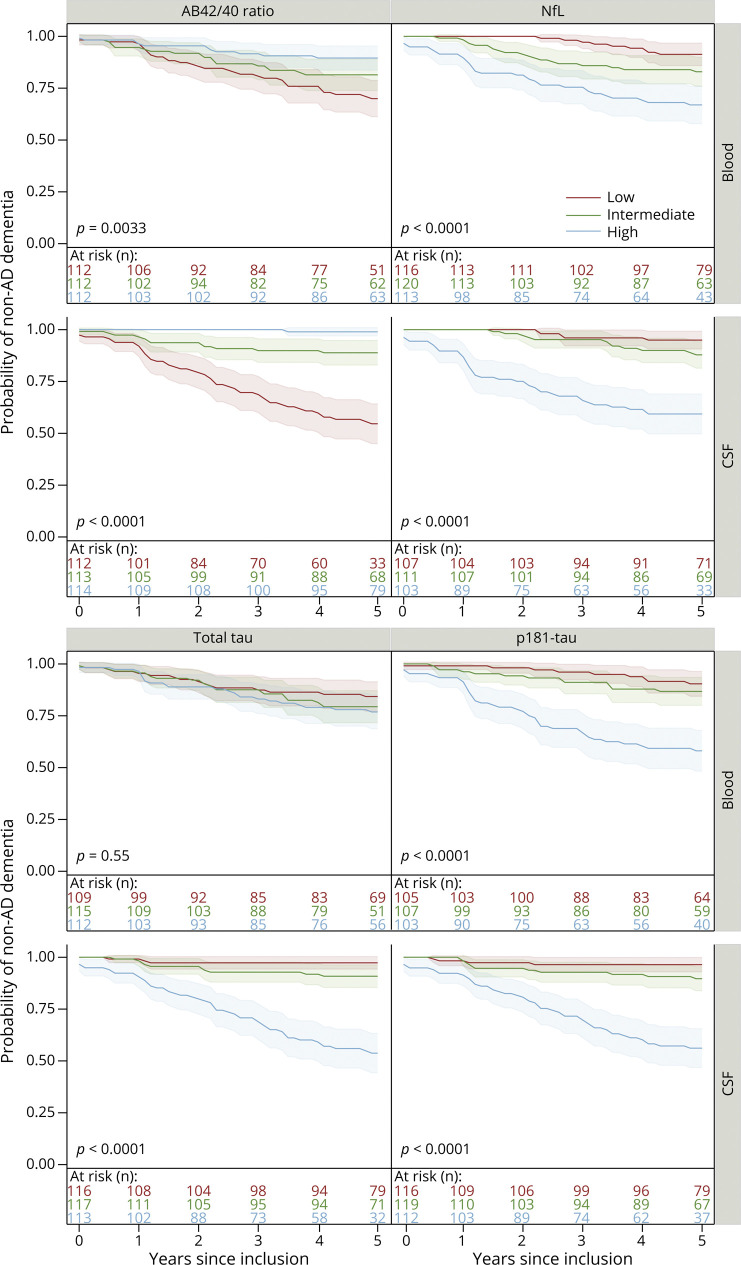
Figure 2. Kaplan-Meier Survival Curves Representing the Association Between Incident AD Dementia and Baseline Blood (Top Panel) or CSF Biomarkers (Bottom Panel) Concentrations During a 5-Year Follow-up Period (CSF Subsample).
Each biomarker was divided in 3 tertiles of distribution (low in red, intermediate in green, high in blue). p-values are for log-rank tests among the tertiles. Aβ = amyloid beta; AD = Alzheimer disease; NfL = neurofilaments light chain.

