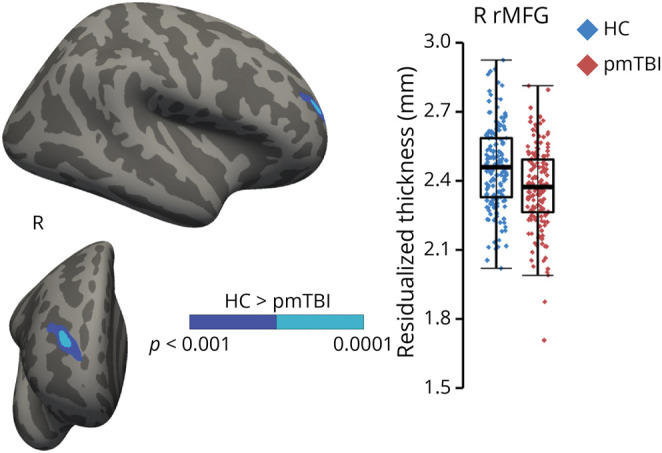
Figure 2. Group Effects in Cortical Thickness Analysis.

Main effect of group from the cortical thickness analysis for patients with pediatric mild traumatic brain injury (pmTBI; red diamonds) and healthy controls (HCs; blue diamonds). An inflated brain rendering presents a significant cluster within the right (R) rostral middle frontal gyrus (rMFG), with pmTBI exhibiting decreased cortical thickness relative to HC (dark blue: p < 0.001; cyan: p < 0.0001). Data points in the box-and-scatter plot have been residualized (Resid.) to remove the effect of age.
