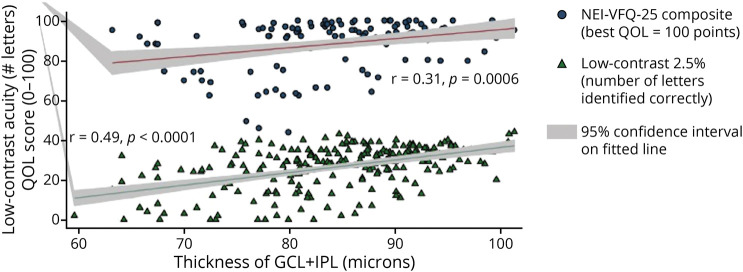
Figure 5. Scatter Plot and Fitted Linear Regression Line Showing Relation of Ganglion Cell Layer Plus Inner Plexiform Layer (GCL + IPL) Thickness to 25-Item National Eye Institute Visual Functioning Questionnaire (NEI-VFQ-25) Composite Scores and Low-Contrast Acuity at the 2.5% Level.
The regression lines represent fitted values for mean GCL + IPL thickness for each value of NEI-VFQ-25 or low-contrast acuity; the gray shaded areas show the 95% confidence intervals from the standard errors of the predictions for the fitted lines. This graph for all multiple sclerosis eyes illustrates that there are very few outliers with respect to quality of life (QOL) or low-contrast acuity. Linear correlations were significant. Accounting for age and adjusting for within-patient, intereye correlations, the relation of QOL and low-contrast acuity to GCL + IPL thickness was significant (p < 0.001, generalized estimating equation models).

