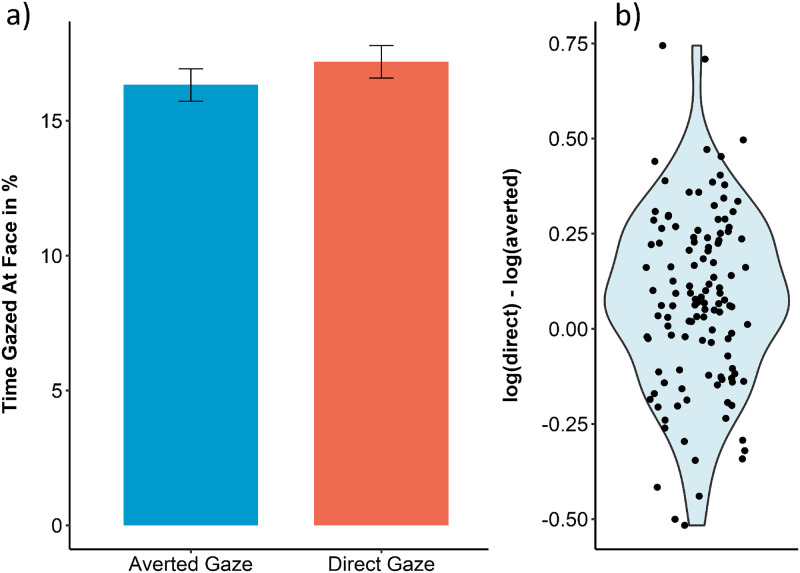
Fig 1.
(a) Time spent looking at faces when they looked away from the camera (averted gaze) compared to when they looked into the camera (direct gaze). Error bars represent SEM. (b) Violin plot showing the differences between attention towards faces when depiciting direct compared to averted gaze for all 120 participants. Positions on the x-axis are randomized for better visibility. This graph shows log-transformed data, directly corresponding to the statistical analysis described in the text.

