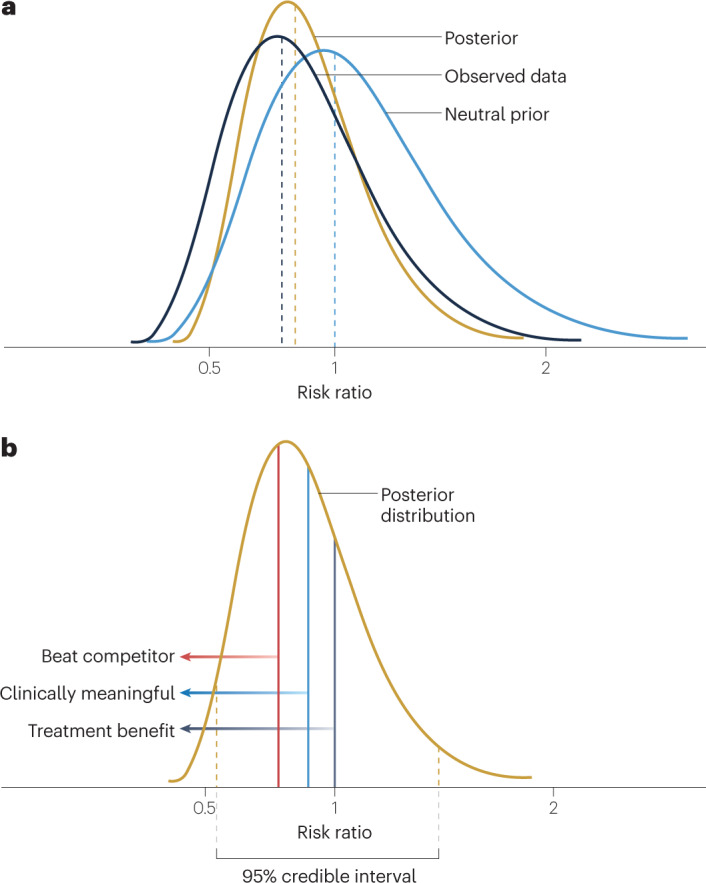
Fig. 3. Posterior distributions in Bayesian clinical trials.

a, The posterior distribution of the treatment effect parameter is a description of the uncertainty of the treatment effect. It is derived statistically from the prior distribution of the treatment effect and the estimated probability distribution of the observed data. b, The posterior distribution of the treatment effect parameter (risk ratio in this depiction) captures the updated description of the uncertainty of the treatment effect. The 95% credible interval has upper and lower bounds such that there is a 95% probability that the true risk ratio lies between those bounds. The posterior distribution can be used to calculate direct probability statements about the risk ratio based on the area under the posterior distribution curve, as depicted by the different vertical lines. In this case, a risk ratio of <1 is indicative of a treatment benefit (dark grey line) and various other risk ratio values can be used to discern the probability of a clinically meaningful treatment effect (blue line) or a treatment effect that is superior to a competitor (red line).
