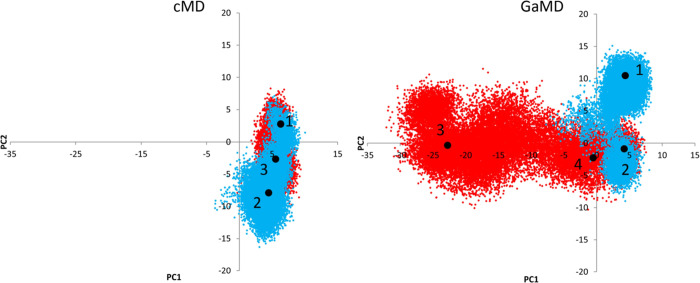
Figure 2.
Representation of the first two PCs sampled using cMD and GaMD approaches. Blue and red indicate the two different molecular dynamics simulations. The big black points are the positions of the selected representatives for the clusters with more than 10% of the total population; three for the cMD and four for the GaMD.

