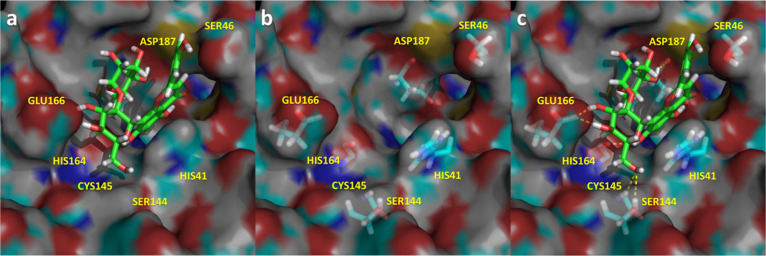
Figure 7.
Spatial representation of the complex Mpro-Vitexin-2-O-rhamnoside in its last snapshot of the 1.5 μs molecular dynamics. (a) Ligand bound to the binding pocket; (b) spatial distribution of the most important residues that interact with the ligand; (c) ligand–protease hydrogen bonds in yellow.

