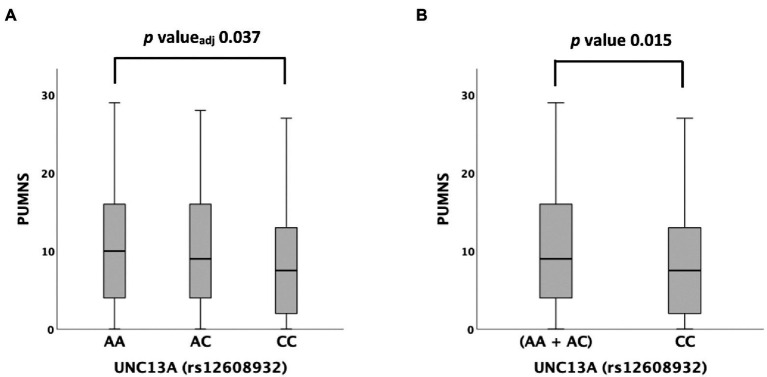
Figure 2.
Distribution of PUMNS amongst UNC13A rs12608932 genotypes according to the Kruskal–Wallis one-way analysis of variance for independent samples. (A) Additive model. (B) Recessive model. For each group, the bold line shows the median, the gray box includes the middle 50% of the data and whiskers show the minimum and maximum values. Empty circles represent outliers.

