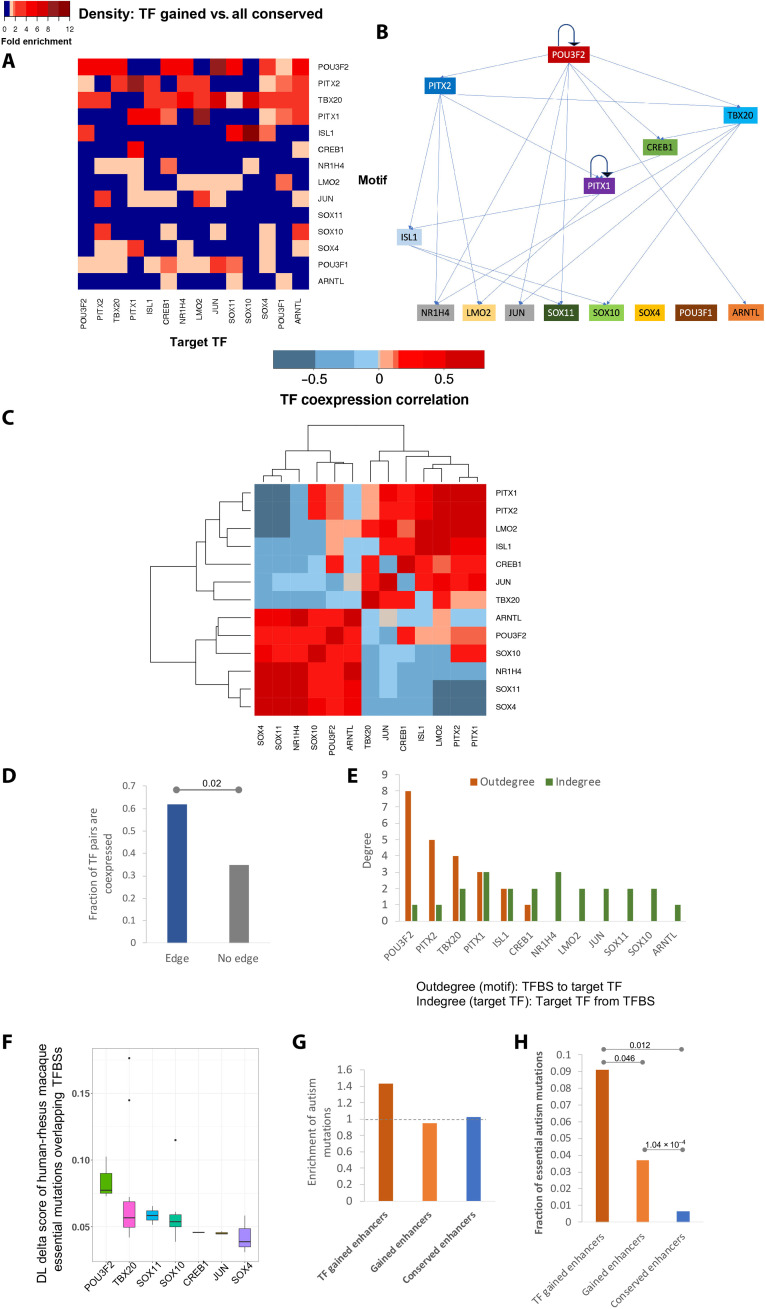
Fig. 6. A hierarchical regulatory network of TFs induced by de novo gained enhancers.
(A) Enrichment of density of TFBSs of the 14 TFs in the locus of the 14 TF genes. (B) Inferred hierarchical structure of the 14 TFs. (C) Spearman correlation coefficient of the 14 TF genes across the embryonic human and macaque individuals. (D) Comparison of fraction of TF pairs that are coexpressed (Spearman correlation coefficient > 0.3) between the pairs with links and those without links. P value is calculated using Fisher’s exact test. (E) Out-degree and in-degree of each TFs. (F) Distribution of DLM delta score caused by the essential mutations overlapping the 14 TFs. (G) Fraction of autism de novo mutations located within each set of enhancers normalized by the fraction of common SNPs falling into the same set of enhancers. (H) Fraction of autism de novo mutations within each set of enhancers, which are essential.

