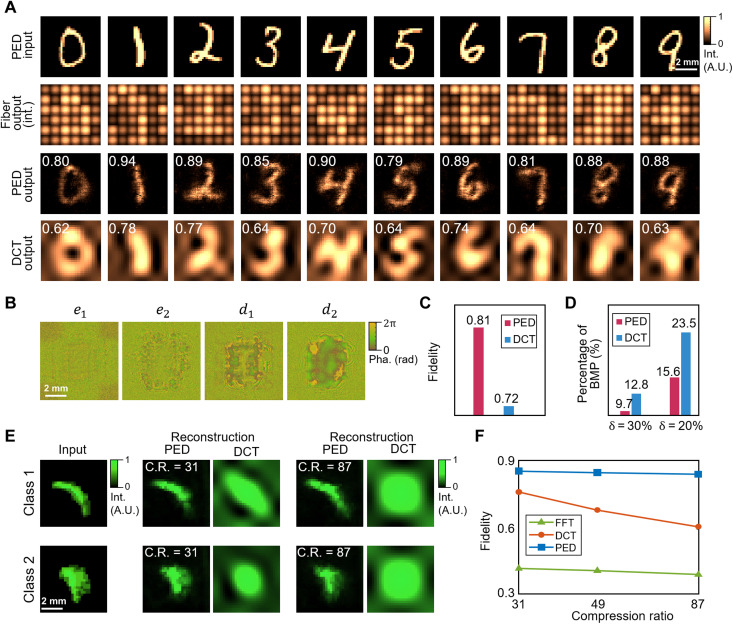
Fig. 4. Experimental results of PED for the data-specific mode.
(A) Inputs, i.e., handwritten digits from 0 to 9, 28 ×28 grayscale pixels each (the first row), are optically transformed by the encoder and transmitted using their OLS representations. The OLS with a dimensionality of 6 × 6 is obtained by fiber coupling the optical field of different subregions on the encoder output plane, where the transmission noise is included as the variation of the OLS representations (the second row). Both amplitude noise (24 dB) and phase noise in transmission are simulated in the fiber link. The optical fields of fiber outputs are optically decoded by the decoder to reconstruct the input handwritten digits (the third row), demonstrating superior performance than DCT compression under the same compression ratio (the fourth row). Their reconstruction fidelities are labeled on each corner. Experimental results are shown here. (B) Phase masks of the diffractive layers of the PED in this task. en (n = 1, 2) is the n-th layer of the encoder, and dn (n = 1, 2) is the nth layer of the decoder. (C and D) The experimental reconstruction fidelity and percentage of bad matching pixels (BMP) of the PED and DCT averaged over the MNIST test dataset (10k images). (E) Experimental reconstruction of the PED compared with DCT at different compression ratios over the projected adrenal CT images from MedMNIST (42). C.R., compression ratios. (F) Experimental reconstruction fidelity of the PED, DCT, and FFT (fast Fourier transform) at different compression ratios. The PED surpasses the other two mainstream methods notably overall demonstrated compression ratios.

