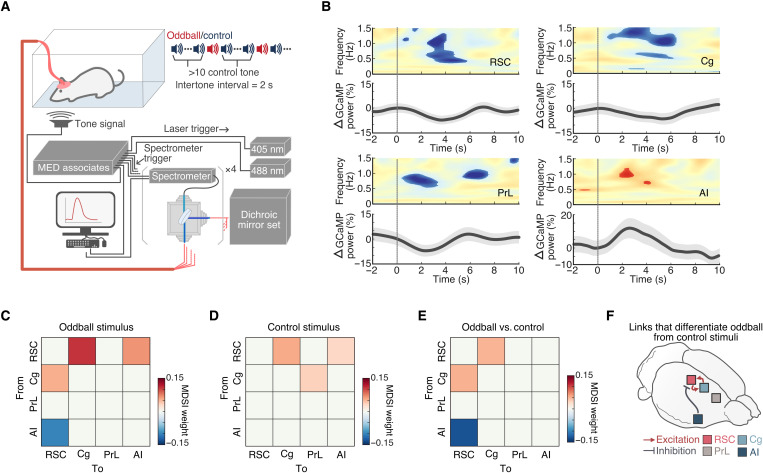
Fig. 5. Neuronal activity changes time-locked to acoustic oddball stimuli.
(A) Schematic illustrating the oddball experiment paradigm. (B) Statistical map of GCaMP spectrogram (P < 0.05, n = 9, two-tailed t test) and percentage GCaMP power changes time-locked to acoustic oddball stimuli presentations (vertical line). (C to F) Causal interactions between the AI, Cg, PrL, and RSC during oddball stimulation. Causal relationships between regions were estimated during oddball and control stimuli presentations using MDSI. (C) During oddball stimuli, significant inhibitory causal influence was observed from the AI to the RSC, and significant excitatory causal influence was observed from the RSC to the Cg and AI and from the Cg to the RSC (all P < 0.01, n = 9, FDR-corrected). (D) Significant excitatory causal influence was observed from the RSC to the Cg and AI and from the Cg to the PrL during control stimuli (all P < 0.01, n = 9, FDR-corrected). (E) Compared to control stimuli, oddball stimuli evoked significantly stronger inhibitory causal influence from the AI to the RSC and significantly stronger bidirectional excitatory influences between the Cg and the RSC (all P < 0.01, n = 9, two-tailed t test, FDR-corrected). (F) Summary illustration of the specific links that showed significant differences in causal interactions between oddball and control stimuli.

