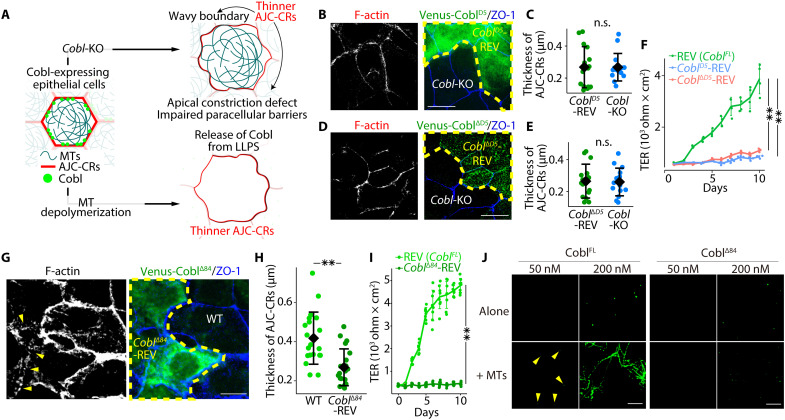
Fig. 5. Neither CoblD5, CoblΔD5, nor CoblΔ84 rescued the phenotype of Cobl-KO cells.
(A) Schematic drawing of the effects of Cobl-KO and MT depolymerization on cultured epithelial cells. (B) Cocultures of Cobl-KO and CoblD5-REV cells. (C) CoblD5 alone did not rescue the phenotype of Cobl-KO cells (i.e., thinner CRs). n.s., not significant (Mann-Whitney U test). N = 16 cells each. Scale bar, 10 μm. (D) Cocultures of Cobl-KO and CoblΔD5-REV cells. (E) CoblΔD5 alone did not rescue the phenotype of Cobl-KO cells (i.e., thinner CRs). n.s., not significant (unpaired t test). N = 15 cells each. Scale bar, 10 μm. (F) Daily changes in TER in REV, CoblD5-REV, and CoblΔD5-REV cells. **P < 0.01 (unpaired t test). N = 4 trials each. (G) Cocultures of WT and CoblΔ84-REV cells revealed that the CR was still thinner in CoblΔ84-REV cells (yellow arrowheads) than in WT cells. Scale bar, 10 μm. (H) CR thickness. **P < 0.01 (Mann-Whitney U test). N = 20 cells, each. (I) Daily changes in TER in REV and CoblΔ84-REV cells. **P < 0.01 (unpaired t test). N = 8 trials, each. (J) In vitro LLPS assay of CoblFL and CoblΔ84 with and without MTs. Similar to the case of CoblFL, CoblΔ84 alone was able to undergo LLPS at a concentration of 200 nM. In the presence of MTs, CoblΔ84 did not undergo LLPS at a concentration of 50 nM in contrast to the case of CoblFL (yellow arrowheads). Scale bar, 10 μm. Protein concentration: FLAG-EGFP-CoblFL, 50 or 200 nM; FLAG-EGFP-CoblΔ84, 50 or 200 nM; and MTs, 8 μM. Diamonds in dot plots and solid lines in line graphs represent means, and error bars represent SDs.

