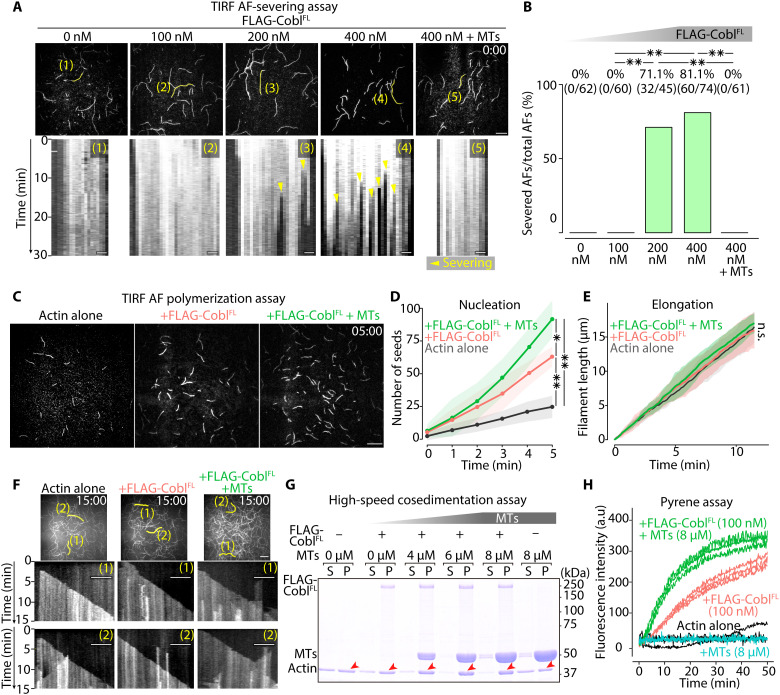
Fig. 7. MTs biased Cobl activity toward actin assembly.
(A) Representative micrographs at the time when FLAG-CoblFL was added (t = 0 min) to AFs (see also movie S8), with respective kymographs showing the time course of the marked filaments (yellow lines). Protein concentration: Alexa Fluor 488–labeled G-actin, 0.5 μM; FLAG-CoblFL, 0, 100, 200, or 400 nM; and MTs, 0 or 4 μM. Scale bar, 10 μm (micrographs) and 1 μm (kymographs). (B) Severing probability quantified at 30 min after FLAG-CoblFL addition. **P < 0.01 (Fisher’s exact test). (C) Representative micrographs at 5 min after initiating polymerization (see also movie S9). Protein concentration: Alexa Fluor 488–labeled G-actin, 1 μM; FLAG-CoblFL, 0 or 100 nM; and MTs = 0 or 8 μM. Scale bar, 10 μm. (D) Time course of the number of seeds [per one TIRF movie (81.92 μm2)] for 5 min after initiating the polymerization. **P < 0.01 and *P < 0.05 (unpaired t test). N = 3 trials each. (E) Change in AF length over time (unpaired t test). N = 15 filaments each. (F) Kymographs of the marked filaments (yellow lines in representative micrographs) demonstrated similar elongation rates. Scale bar, 10 μm (micrographs) and 5 μm (kymographs). (G) High-speed cosedimentation assay showing a change in the actin pellet (P) fraction (red arrowheads; see also fig. S13D) in the presence of Cobl and MTs. Protein concentration: G-actin, 1 μM; FLAG-CoblFL, 0 or 100 nM; and MTs, 0, 4, 6, or 8 μM. (H) MTs increased the slope of the Cobl actin polymerization curves. Protein concentration: pyrene-labeled G-actin, 1 μM; FLAG-CoblFL, 0 or 100 nM; and MTs, 0 or 8 μM. N = 3 trials each. Solid lines represent means, and shaded areas represent SDs.

