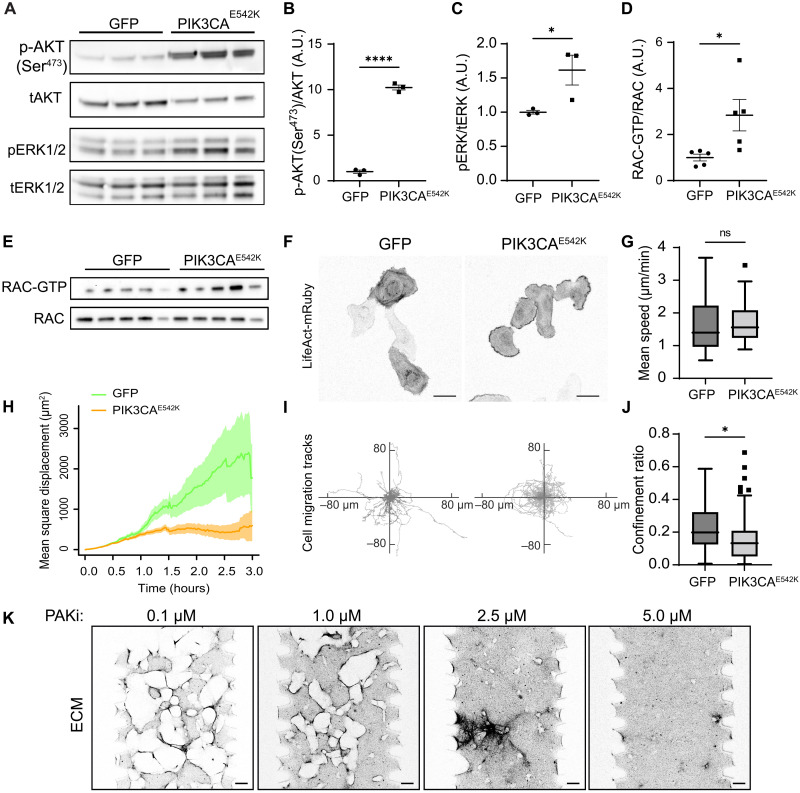
Fig. 7. Endothelial cells expressing PIK3CA mutation display molecular signatures of excessive Rac1 and MEK/ERK signaling.
(A to C) Western blot analysis (A) and quantification of relative p-AKT1(Ser473) (B) and p-ERK1/2(Thr202/Tyr204) (C) levels in serum-starved GFP control and PIK3CAE542K endothelial cells (n = 3; means ± SEM; two-tailed unpaired Student’s t test, *P ≤ 0.05; ****P ≤ 0.0001). (D and E) Quantification (D) and Western blot (E) of active Rac1/2/3 level in GFP control and PIK3CAE542K endothelial cells. Active Rac1/2/3 was isolated using a glutathione S-transferase–tagged p21-binding domain of PAK1 (n = 5; means ± SEM; two-tailed unpaired Student’s t test, *P ≤ 0.05). (F) Representative images of GFP and PIK3CAE542K cells expressing LifeAct-mRuby, cultured in 2D. Note the presence of actin-rich membrane ruffles at the periphery of PIK3CAE542K cells. Scale bars, 50 μm. (G to J) Mean migration speed (G), mean square displacement (H), migration trajectories (I), and confinement ratios as defined by net displacement over total traveled distance (J) of GFP and PIK3CAE542K cells (n = 57 and 60 tracks, Tukey box and whisker, two-tailed unpaired Student’s t test, *P ≤ 0.05). (K) Representative confocal images of ECM surrounding PIK3CAE542K vascular networks treated with 0.1 to 5.0 μM of PAK inhibitor, PF-3758309. Scale bars, 100 μm.

