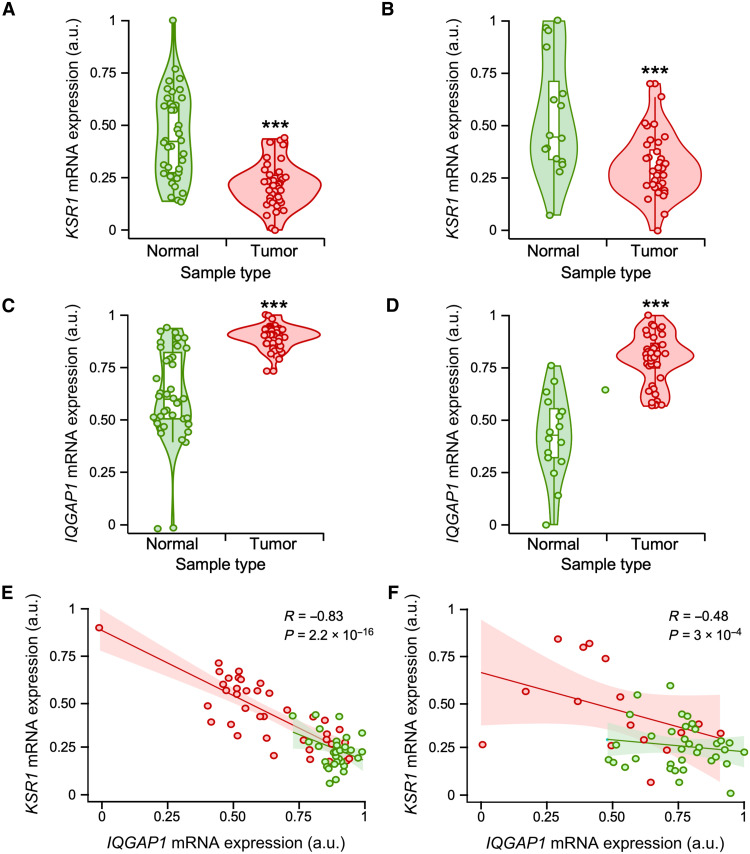
Fig. 7. Negative correlation of KSR1 and IQGAP1 mRNA levels in tumors.
(A to D) Relative expression levels of KSR1 (A and B) and IQGAP1 (C and D) transcripts in healthy and tumor samples obtained from the microarray datasets GSE15471 (A and C) and GSE16515 (B and D). (E and F) Regression graph showing the negative correlation between KSR1 and IQGAP1 transcripts levels in microarray datasets GSE15471 (E) and GSE16515 (F). Dots, violin plots, and regression line colors correspond to tumor (red) and healthy (green) samples from the indicated dataset. ***P < 0.001 (A to D). In (D) and (F), the regression coefficient and P value are indicated in each case (see also fig. S3).

