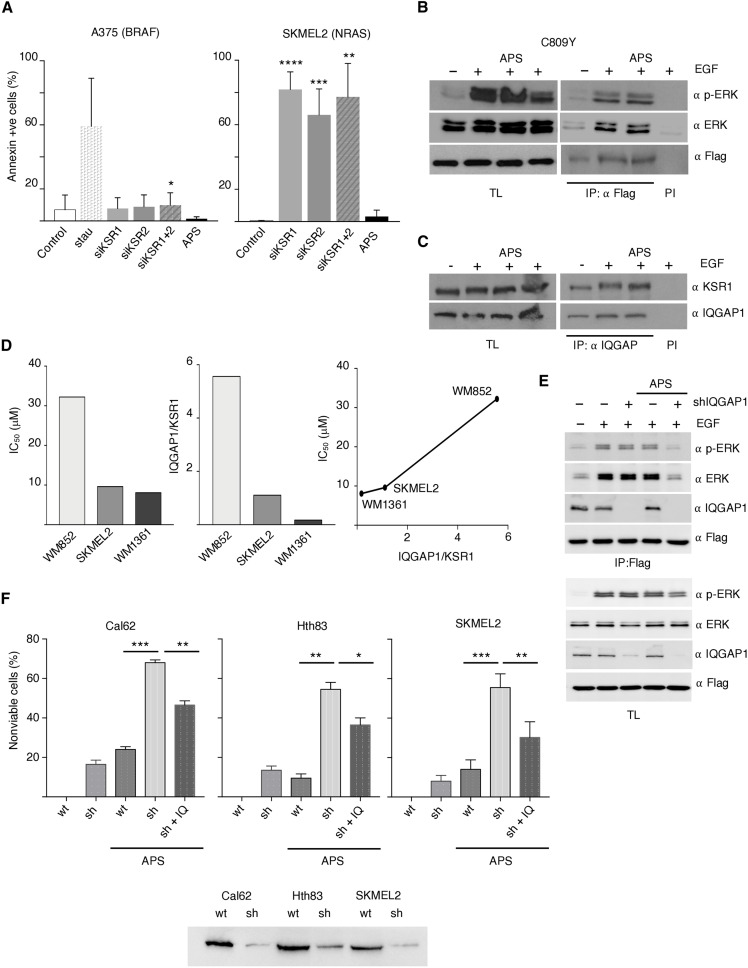
Fig. 8. IQGAP1 impact on APS 2-79 efficacy.
(A) APS-2-79 does not phenocopy the effect of KSR1/2 ablation. A375 and SKMEL2 cells were transfected with the indicated shRNAs or an empty vector as a negative control (c) or treated with APS-2-79 (5 μM, 48 hours). Staurosporine (0.5 μM, 48 hours) was used as a positive control. Apoptosis was evaluated 48 hours after transfection by scoring annexin V levels. Data show means ± SEM from three independent experiments. P values: ****P < 0.001, ***P < 0.005, **P < 0.01, and *P < 0.05 by Student’s t test. (B) APS-2-79 does not affect phosphorylated ERK levels incorporated to KSR1. Endogenous levels bound to KSR1 C809Y were determined by coimmunoprecipitation analyses in APS-2-79–treated cells, stimulated with EGF (50 ng/ml, 5 min) where shown (+) after 18-hour starvation. (C) APS-2-79 does not affect KSR1-IQGAP1 interaction. Association of the endogenous proteins was determined by coimmunoprecipitation analyses. (D) IC50 and IQGAP1/KSR1 ratio in the indicated NRAS-mutant cell lines and correlation between both parameters. Data show mean of three independent experiments. (E) Impact of IQGAP1 depletion on the APS-2-79 inhibitory effect on KSR1. As in (C), IQGAP1 was depleted by shRNA where indicated. (F) IQGAP1 depletion effects on APS-2-79 efficacy. The indicated tumor cells: wt, IQGAP1 down-regulated using shRNAs (sh), and IQGAP1 down-regulated transfected with an ectopic IQGAP1 (1 μg; sh + IQ) were treated with APS 2-79 where indicated. Data show means ± SEM, % of nonviable cells for three independent experiments. P values: ***P < 0.005, **P < 0.01, and *P < 0.05 by Student’s t test. Bottom: IQGAP1 levels in the indicated cell lines. In all cases, immunoprecipitations were performed with a specific antibody (IP) or with preimmune serum (PI). All the results shown are representative of three to five independent experiments (see also fig. S4).

