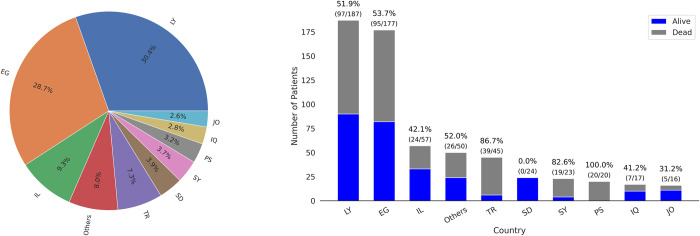
Fig 4.
Distribution of patients admitted to non-European ICUs as a percentage of the overall non-European cohort (left panel). Number of patients admitted to non-European ICUs as well as the mortality rate per non-European country, shown as a ratio between survivors (blue) and non-survivors (grey) (right panel). Country and territory abbreviations are detailed in S9 Text.

