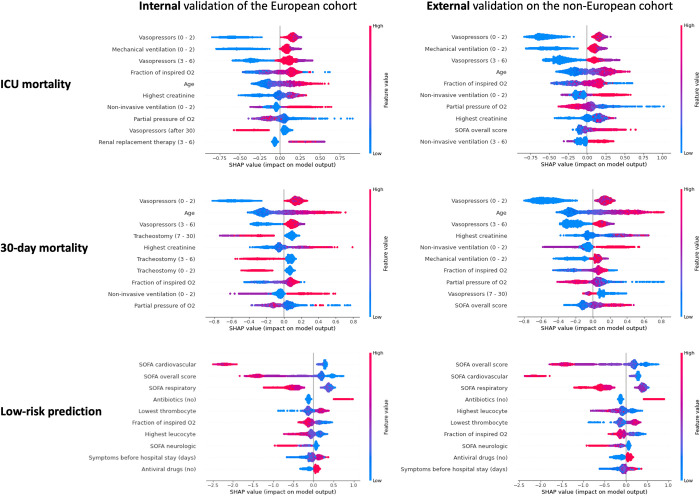
Fig 8.
SHAP summary plots showing the top-10 most important variables for each of the three outcomes of interest, when evaluating the European model internally (left) as well as externally on the non-European cohort (right). Colour represents the actual value of the variables (red indicating higher values), while the higher the SHAP value of a variable (depicted in the x-axis), the higher the estimated probability of the outcome. For some variables we also indicate the interval of occurrence, for example “Vasopressors (0–2)” indicates administration of vasopressors during the first 2 days from the admission.

