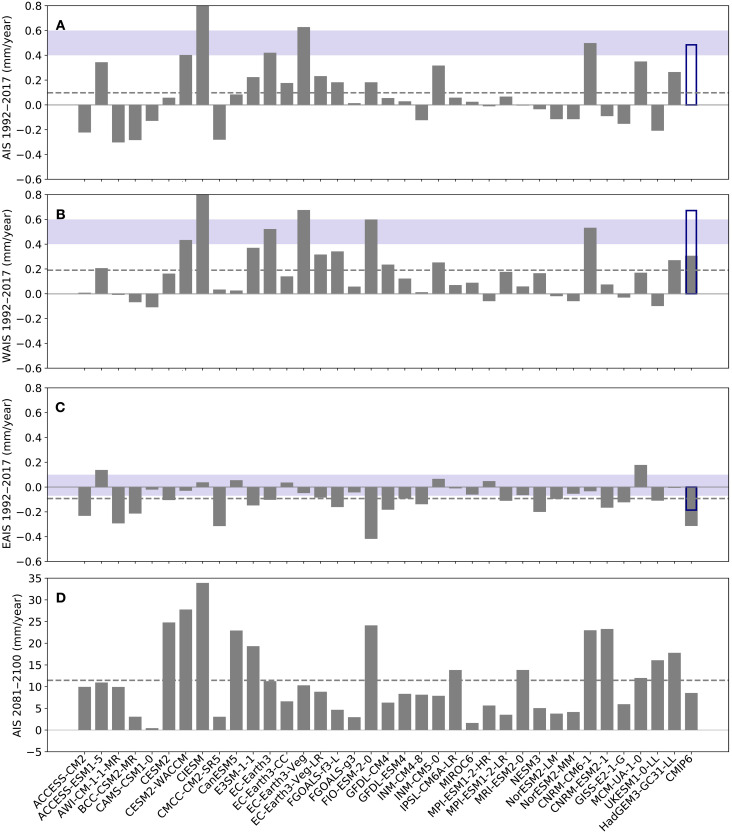
Fig. 6. Simulated rates of GMSL change.
(A) Contributions to the mean rate of change in GMSL during the IMBIE period (1992–2017) by the AIS in simulations forced by bias-corrected CMIP6 model climates, where the likely ranges estimated by IMBIE are marked by horizontal blue bars. (B) Same as (A) but for the WAIS. (C) Same as (A) but for the EAIS. (D) Same as (A) but for the late-century period 2081–2100 under the SSP5-8.5 scenario. Results from each model are shown in gray bars, and the horizontal dashed lines represent the multimodel mean. Gray bars labeled as “CMIP6” represent an ice sheet simulation forced by the multimodel mean climate fields of 36 models, while hollow blue bars are for a similar simulation but with forcings during 1980–2019 replaced by observed fields from ERA5 and WOA18.

