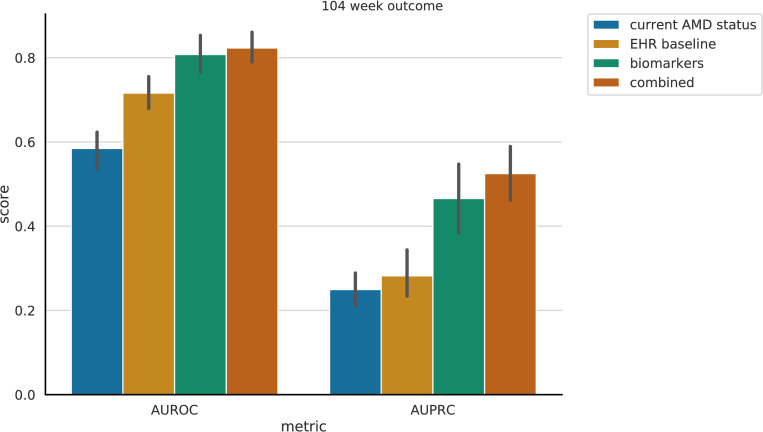
Fig 1. Exudative AMD prediction performance.
Left: Areas Under the Receiver Operating Characteristic (ROC) curve. Right: Areas Under the Precision-Recall (PR) curve. Each bar represents the performance utilizing a different set of features (see legend). Error lines represent the 95% confidence intervals, computed using bootstrapping.

