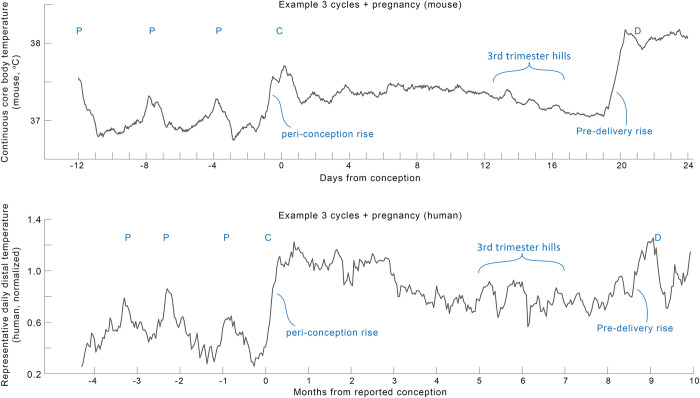
Fig 4.
Comparison of one example mouse (top, from (41)) and human (bottom) pregnancy profile revealed many parallel structures in continuous temperature in need of deeper mechanistic investigation. To highlight trends over daily variance, both profiles show moving means with windows of mouse (24 hours on minutely data) and human (7 days on nightly temperature maxima) data. “P”: peaks of putative ovulatory cycles, “C”: conception, “D”: delivery.

