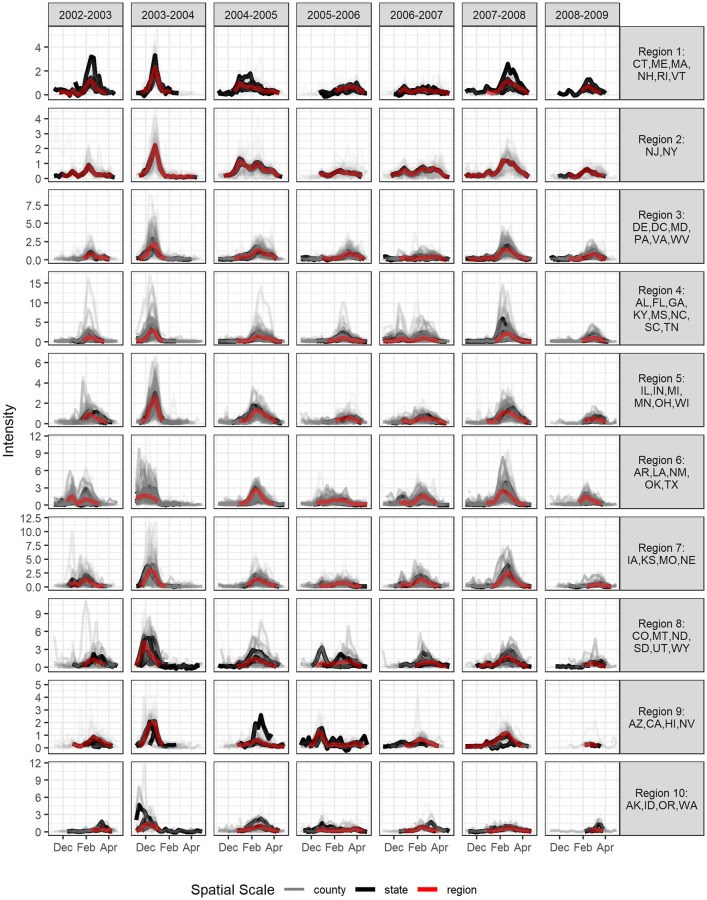
Fig 1. ILI intensity by influenza season from 2002–2003 through 2008–2009 across 10 HHS regions.
ILI intensity is displayed for all available counties and states in a given HHS region in different colors (grey for counties, black for states, and red for region). Some regions (such as Region 1) have fewer counties than others so heterogeneity at the county level may be less apparent.

