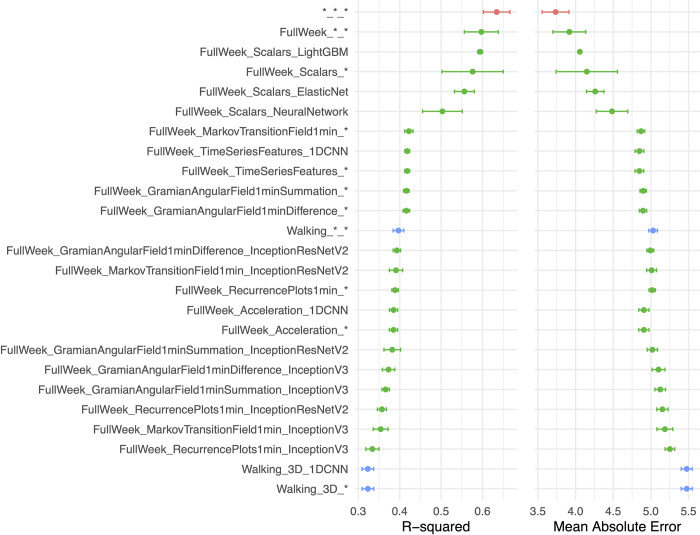
Fig 2. Chronological age prediction performance.
A.) R2 (R-squared) and B.) Mean Absolute Error (MAE). Model name contain the duration (e.g., full week), data type (e.g., Scalars or Time Series), and model algorithm type (e.g., LightGBM). * represents ensemble model. Red point is the overall ensemble across all models, green points denote the measured physical activity for the full week as inputs, and blue points denote the walking or gait data as inputs.

