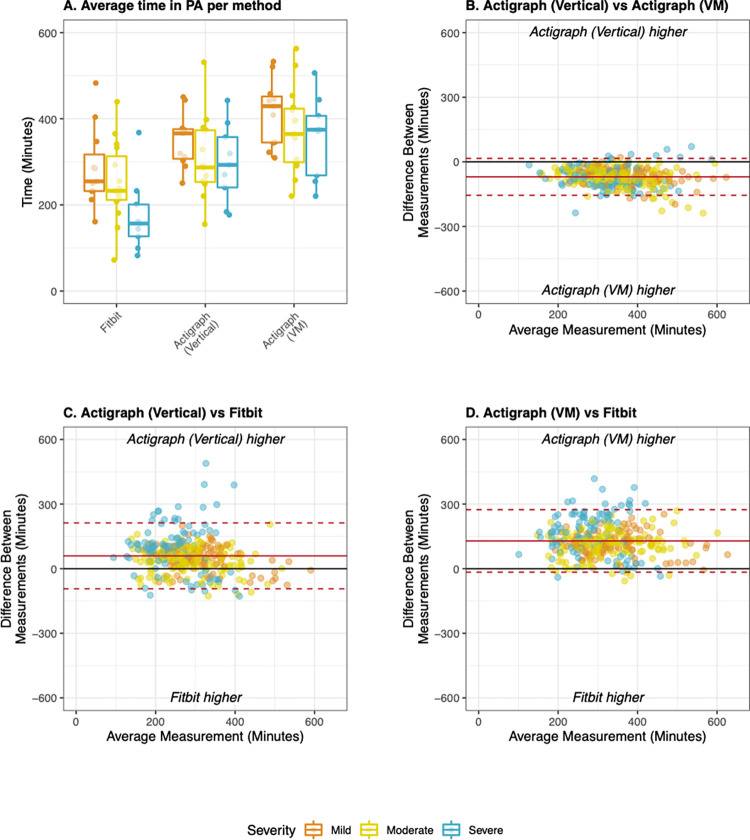
Fig 6. Total time in physical activity derived from Fitbit and Actigraph during free-living evaluation.
A) Average time in PA derived from the Fitbit, Actigraph (Vertical), and Actigraph (VM) stratified by disease severity; B) Bland Altman plot comparing both Actigraph methods to each other; C) Bland Altman plot comparing Fitbit to Actigraph (Vertical), D) Bland Altman plot comparing Fitbit to Actigraph (VM). All Bland Altman plots display data collected during rehab and at home at the daily level of aggregation. Mean bias (solid line) and limits of agreement (dotted lines) were adjusted for patient-level random effects. Mild MS: EDSS < 4.0, Moderate MS: EDSS 4.0–5.5, Severe MS: EDSS 6.0–6.5.

