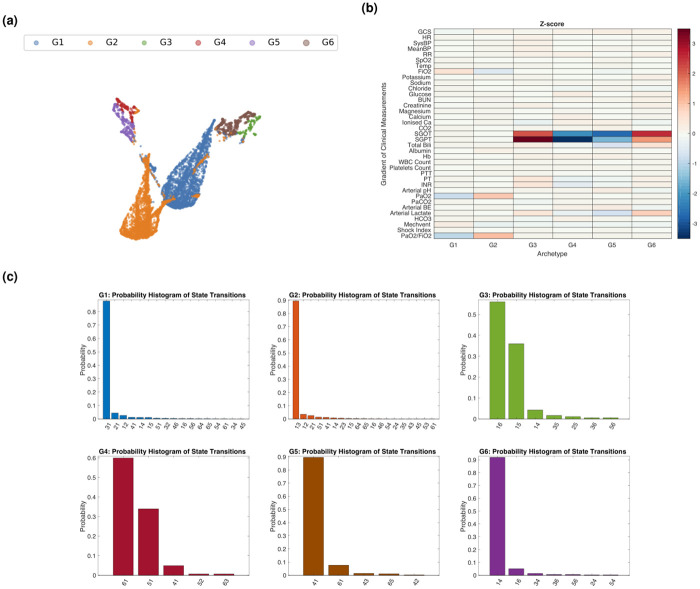
Fig 7.
(A) Visualization (using low-dimensional UMAP embedding) of the six derived gradient groups. (B) Z-score analysis of the gradients of clinical measurements (row) of each gradient group (column). Entries approaching red indicate that the gradient of the clinical readings are expressed in the corresponding gradient groups, and entries closer to blue indicate that the gradient of the clinical readings are suppressed in corresponding gradient groups. (C) Probability histogram of state transitions of each gradient group.

