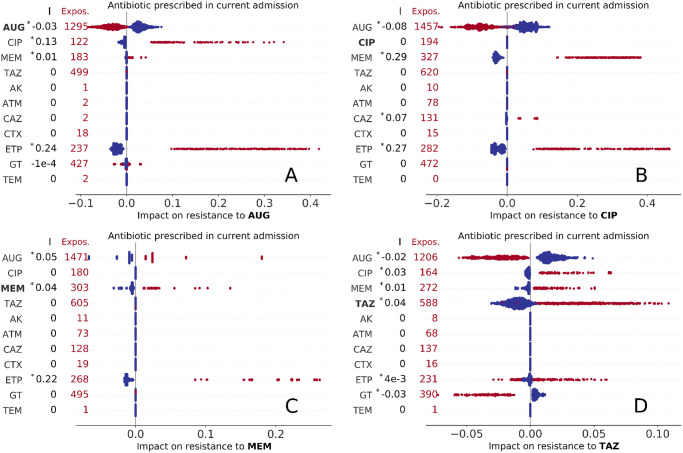
Fig 2. Impact of present use of antibiotics on resistance to AUG, CIP, MEM, and TAZ treatment (A,B,C, and D panels, respectively).
Each marker represents an admission event, with colour red indicating exposure to the treatment and total number of treated episodes reported on the left for each drug. The corresponding Shapley values are represented as horizontal coordinates. Values of the slope index I are reported as measures of the direction and strength of association of the factor with AMR outcome (see also Table E in S1 Text, asterisk (*) indicates statistical significance, P < 0.01).

