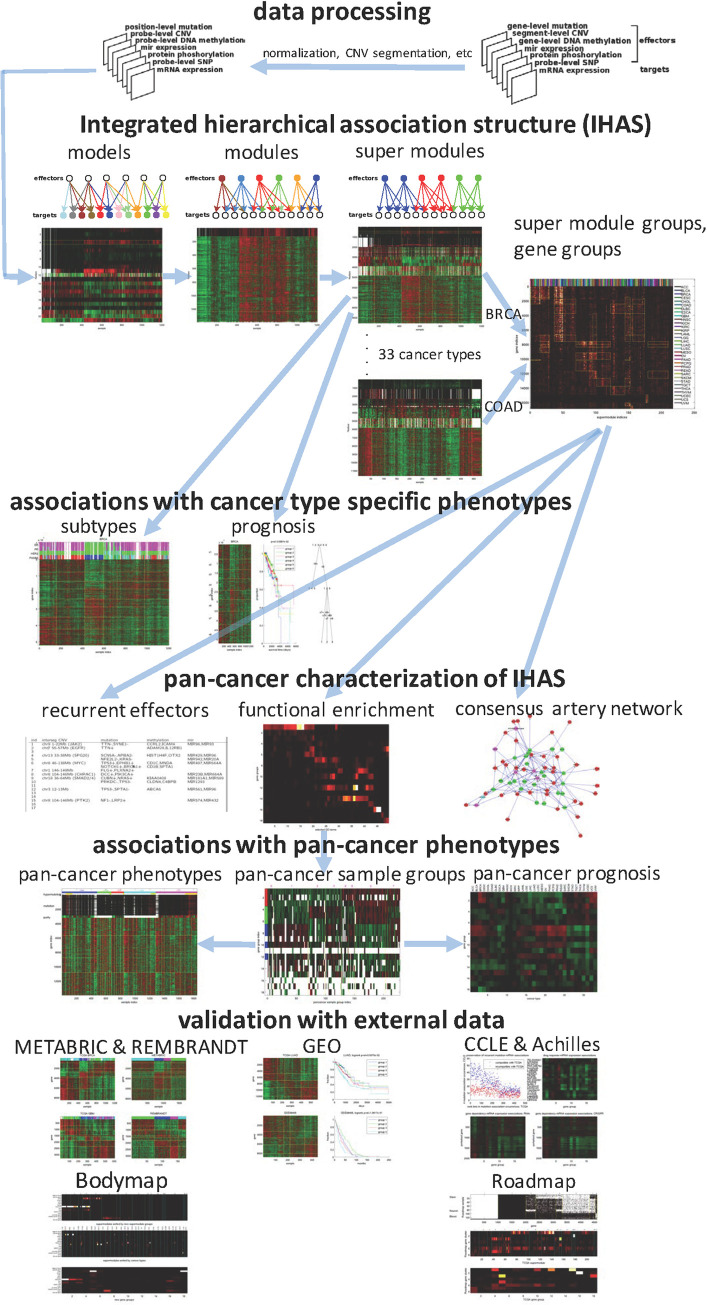
Fig 2. Overview of the integrated analysis and validation framework of pan-cancer omics data.
For each cancer type, multiple types of omics data are converted into the same format (the first row). The hierarchical association structure is inferred from the processed data and includes Association Models, Association Modules, and Super Modules within cancer types and Super Module Groups and Gene Groups across cancer types (the second row). Effectors or targets of the same color in three subgraphs belong to the same Association Models, Association Modules, and Super Modules. We characterize three functional aspects of the hierarchical association structure: Recurrent Effectors that frequently appear in Super Module Groups, functional enrichment of Gene Groups, and the Artery Network that explains many (effector,target) associations in the molecular interaction network (the fourth row). Samples are grouped by combinatorial expression patterns of Super Modules and three Meta Gene Groups within and across cancer types, and are associated with survival outcomes and clinical phenotypes (the third and fifth rows). Finally, the hierarchical association structure is extensively validated in external datasets (the sixth and seventh rows) including the multi-omics data of breast cancer and glioblastoma tumors (METABRIC and REMBRANDT), 294 cancer transcriptomic datasets from GEO, multi-omics cancer cell line data (CCLE and Achilles), transcriptomic and epigenomic data of normal tissues (Bodymap and Roadmap). Blue arrows indicate prerequisite relations of steps in the framework. For instance, the three steps of pan-cancer characterization of IHAS all require Super Module Groups and Gene Groups.

