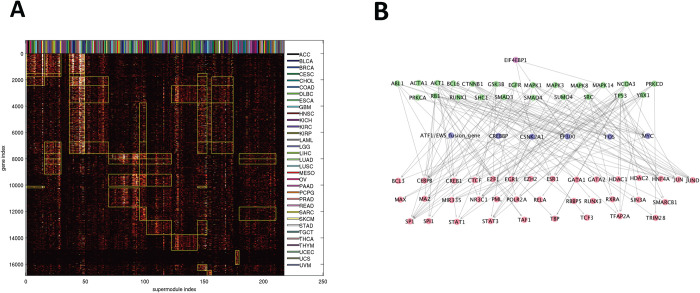
Fig 3. Summary of integrated hierarchical association structure.
A: Memberships of 16860 target genes in 217 Super Modules. Super Modules (columns) are sorted by Super Module Groups, and genes (rows) are sorted by Gene Groups. The heat color of an entry reflects the number of modules encompassing a gene and belonging to a Super Module. A rectangular patch marked by yellow boundaries denotes that a Gene Group is over-represented in a Super Module Group. The cancer types of Super Modules are displayed on the top. B: Consensus Artery Network comprising indispensable interactions for explaining (effector,target) association pairs across multiple cancer types. The subnetwork spanned by highly connected hubs is displayed. Node colors denote hub levels: 1 (red), 2 (purple), 3 (green), 4 (magenta).

