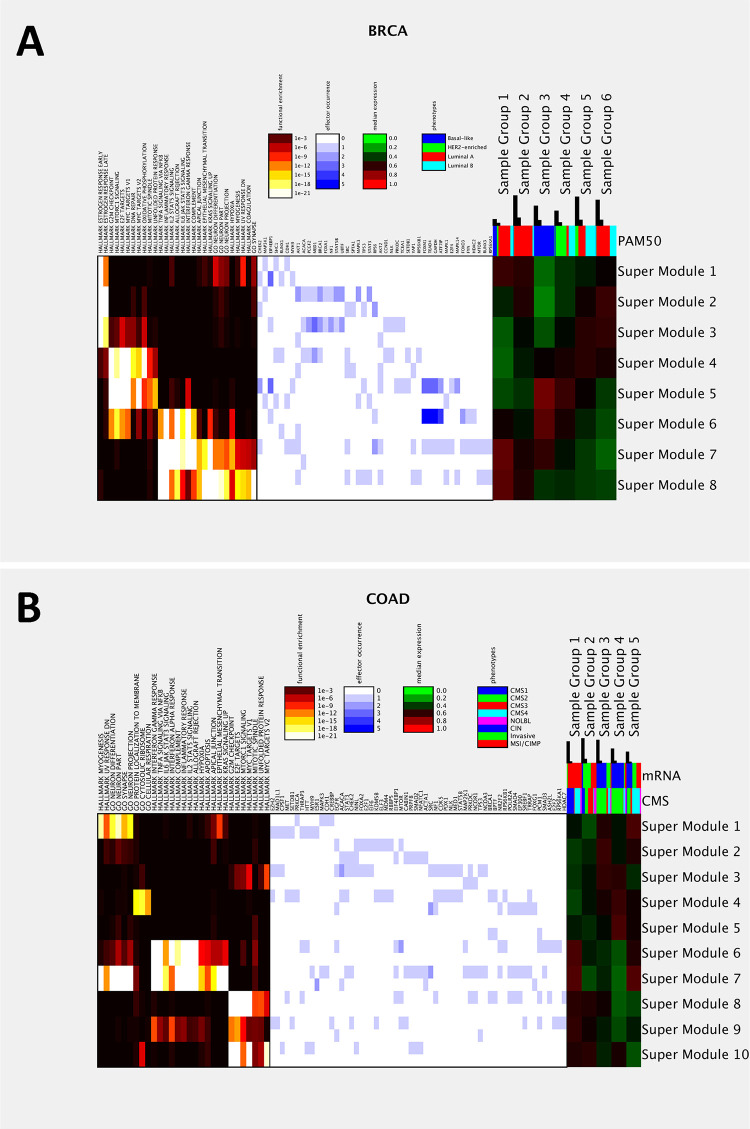
Fig 5. IHAS integrated views in two cancer types.
A: An integrated view of BRCA data. The left panel displays the FDR-adjusted hyper-geometric enrichment p-values of selected Gene Sets in each Super Module. The middle panel displays the occurrences of selected effectors (hubs in the Consensus Artery Network) in each Super Module. The occurrences of positive and negative associations are shown in the upper and lower portions of each grid. The right panel displays the median combinatorial expression of each Super Module in each Sample Group. The colored bars above the right panel shows the composition of clinical phenotypes (PAM50 subtypes for BRCA) in each Sample Group. The black bars above indicate the total number of patients and the number of patients surpassing 5-year survival times in each Sample Group. B: An integrated view of COAD data. Legend follows panel A.

