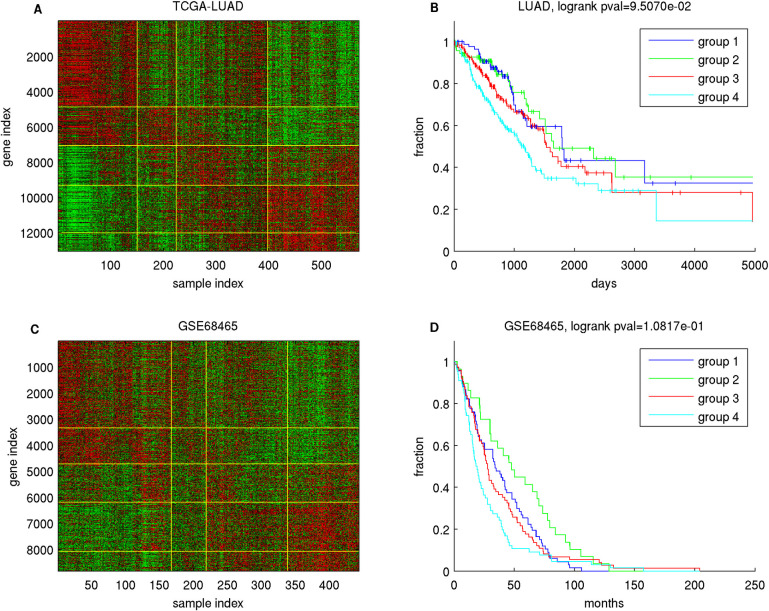
Fig 8.
Sorted expression data and Kaplan-Meier curves of TCGA LUAD data (A and B) and the aligned counterparts (C and D) of a GEO lung cancer dataset (GSE69465). The four Sample Groups are separated by yellow vertical lines (A and C) and from left (group 1) to right (group 4).

