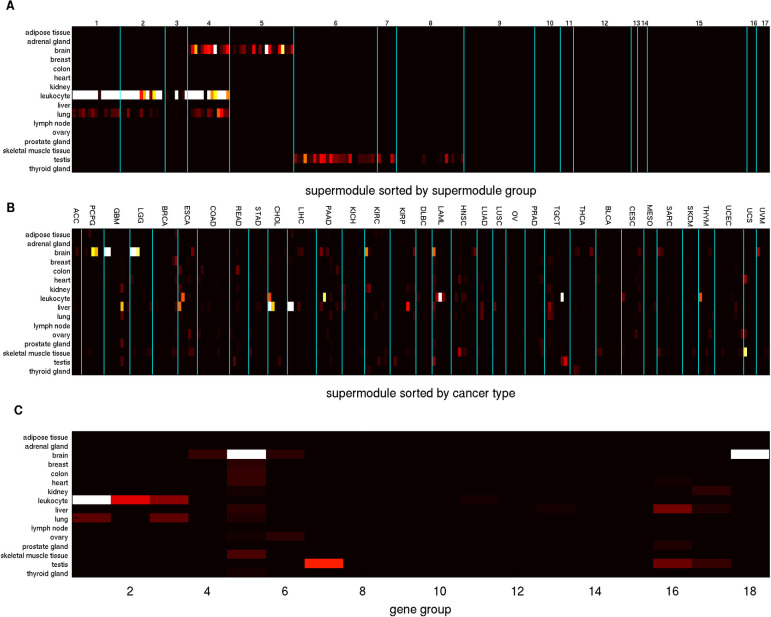
Fig 10.
Enrichment p-values of tissue-specific genes derived from the Illumina Bodymap data in Super Modules sorted by A: Super Module Groups, B: cancer types, and in C: Gene Groups. Enrichment p-values of Super Modules and Gene Groups are reported in S11C and S11D Table.

