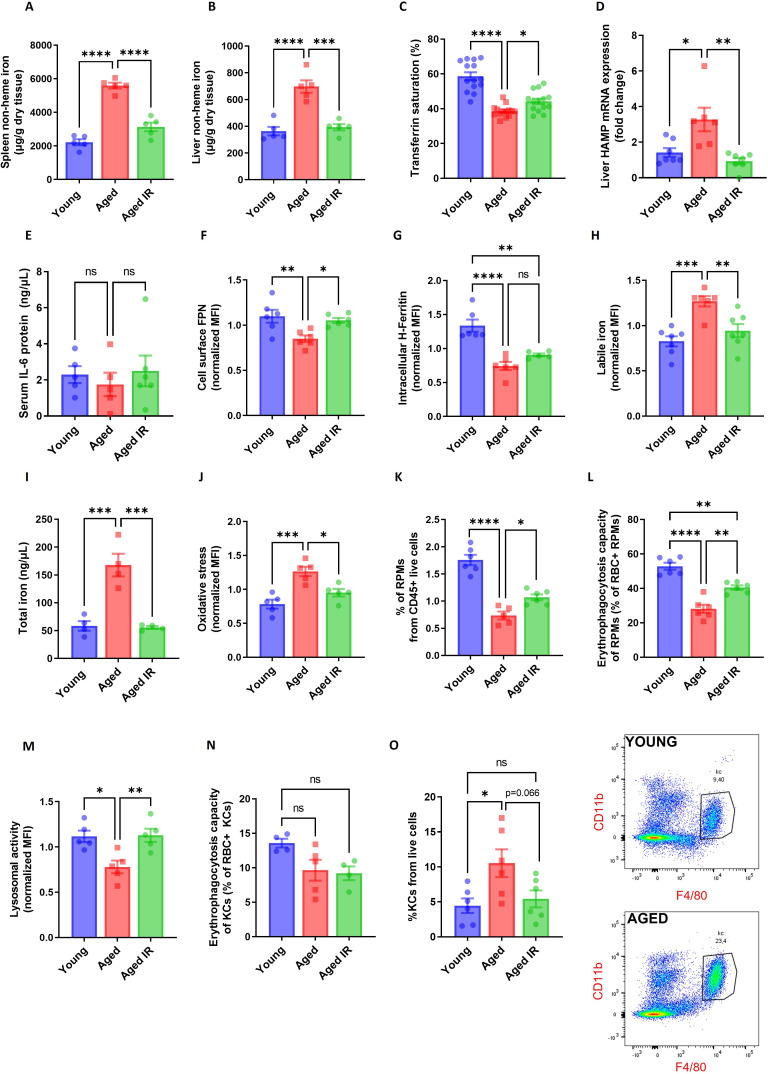
Figure 1. Iron-reduced diet normalizes body iron parameters during aging, diminishes iron retention in RPMs, and prevents oxidative stress.
(A) Splenic and (B) liver non-heme iron content was determined in young, aged, and aged IR mice. (C) Plasma transferrin saturation was determined in young, aged, and aged IR mice. (D) Relative mRNA expression of hepcidin (Hamp) in the liver of young, aged, and aged IR mice was determined by qPCR. (E) Serum IL-6 protein levels in young, aged, and aged IR mice were measured by Mouse IL-6 Quantikine ELISA Kit. (F) Expression of ferroportin (FPN) on the cell membrane of young, aged, and aged IR RPMs was assessed by flow cytometry. (G) Intracellular H-Ferritin protein levels in young, aged, and aged IR RPMs were quantified by flow cytometry. (H) Cytosolic ferrous iron (Fe2+) levels in young, aged, and aged IR RPMs were measured using FerroOrange with flow cytometry. (I) The total intracellular iron content in young, aged, and aged IR magnetically-sorted RPMs was assessed using the Iron Assay Kit. (J) The cytosolic ROS levels in young, aged, and aged IR RPMs were assessed by determining CellROX Deep Red fluorescence intensity with flow cytometry. (K) The percentage of RPMs from CD45 + live cells present in the spleen of young, aged, and aged IR mice was assessed by flow cytometry. (L) Erythrophagocytosis capacity in young, aged, and aged IR RPMs was determined using flow cytometry by measuring the percentage of RPMs that phagocytosed transfused PKH67-labeled temperature-stressed RBCs. (M) Lysosomal activity of young, aged, and aged IR RPMs was determined using Lysosomal Intracellular Activity Assay Kit with flow cytometry. (N) Erythrophagocytosis capacity in young, aged, and aged IR Kupffer cells (KCs) was determined using flow cytometry by measuring the percentage of KCs that phagocytosed transfused PKH67-labeled temperature-stressed RBCs. (O) Percentages of KCs in total live cells in the livers of young, aged, and aged IR mice and representative flow cytometry plots of KCs. Each dot represents one mouse. Data are represented as mean ± SEM. Statistical significance among the three groups was determined by One-Way ANOVA test with Tukey’s Multiple Comparison test. ns p>0.05, *p<0.05, **p<0.01, ***p<0.001 and ****p<0.0001.
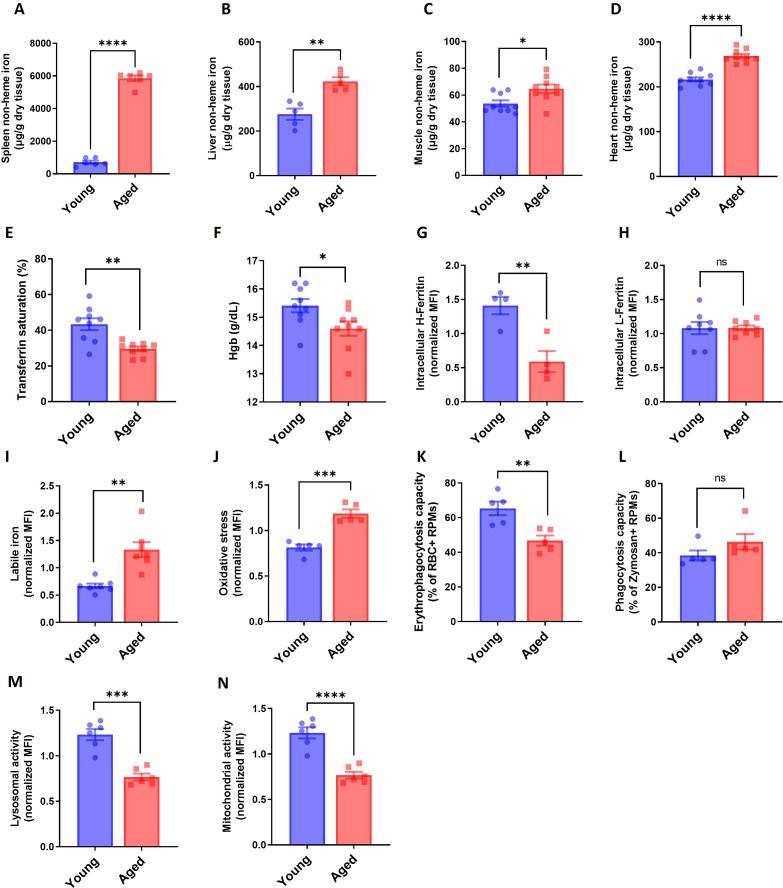
Figure 1—figure supplement 1. RPMs of aged mice show increased labile iron levels, oxidative stress and diminished iron-recycling functions.
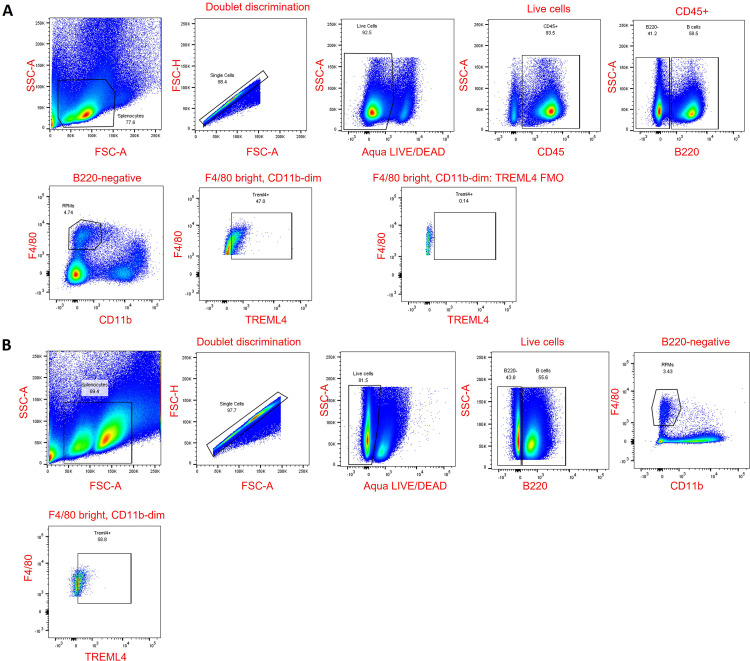
Figure 1—figure supplement 2. Gating strategy for RPMs.
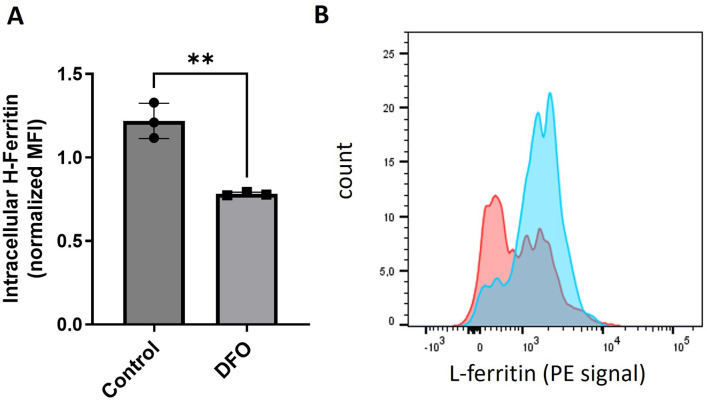
Figure 1—figure supplement 3. Validation of the antibodies against H and L ferritin.
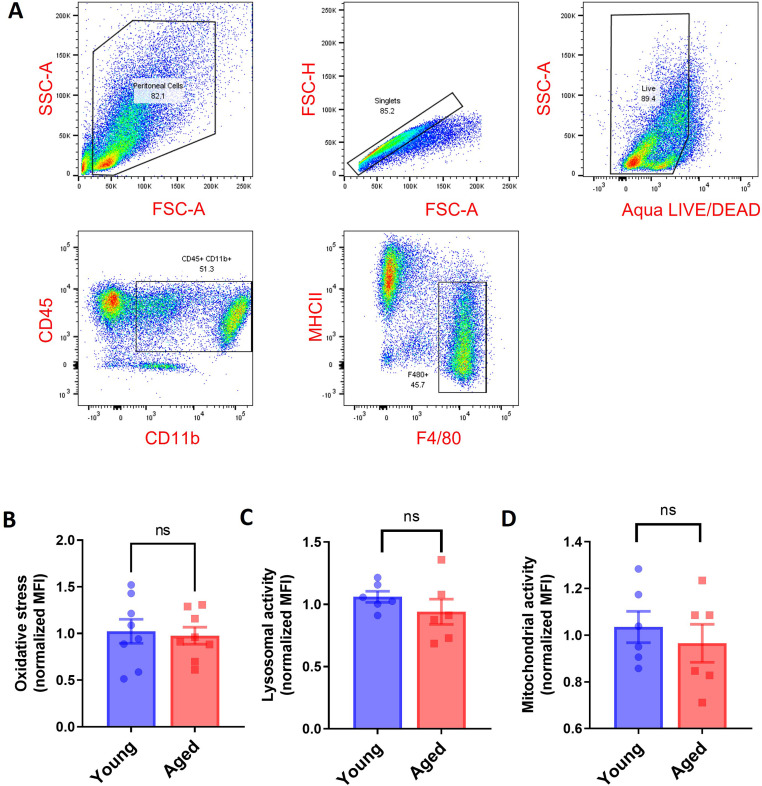
Figure 1—figure supplement 4. Peritoneal macrophages in aged mice do not show functional impairments.
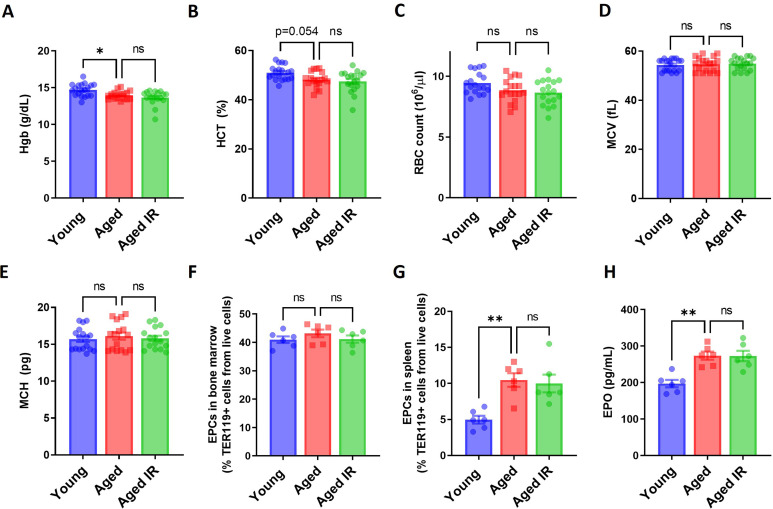
Figure 1—figure supplement 5. Hematological parameters and erythropoietic activity in aging mice.
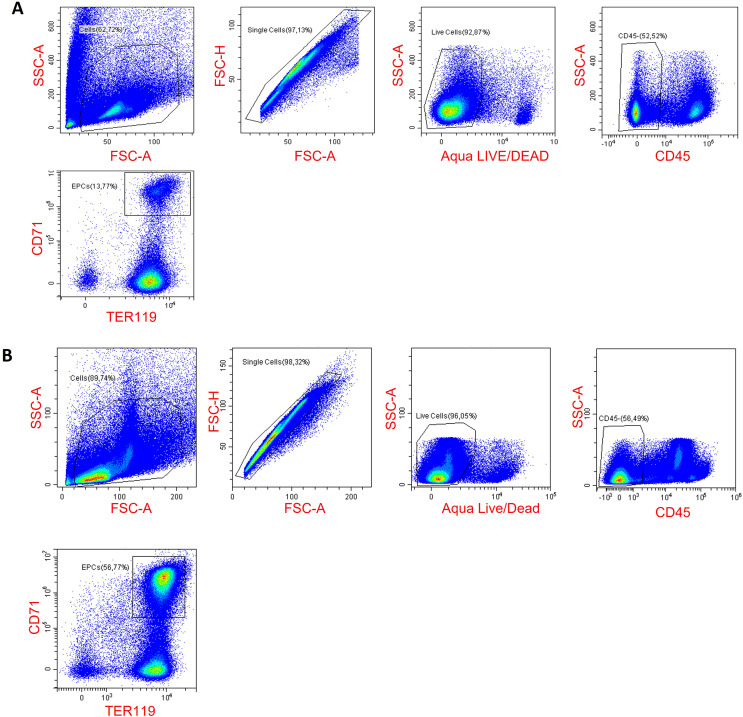
Figure 1—figure supplement 6. Gating strategy for erythroid progenitor cells in the spleen (A) and the bone marrow (B).
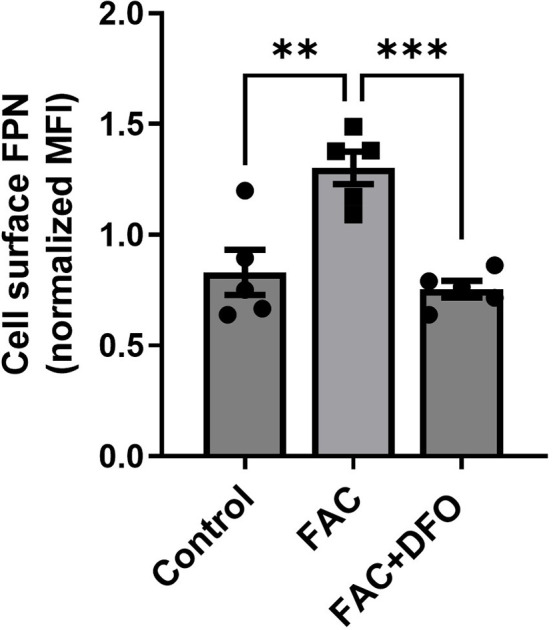
Figure 1—figure supplement 7. Validation of the ferroportin antibody for flow cytometry.
