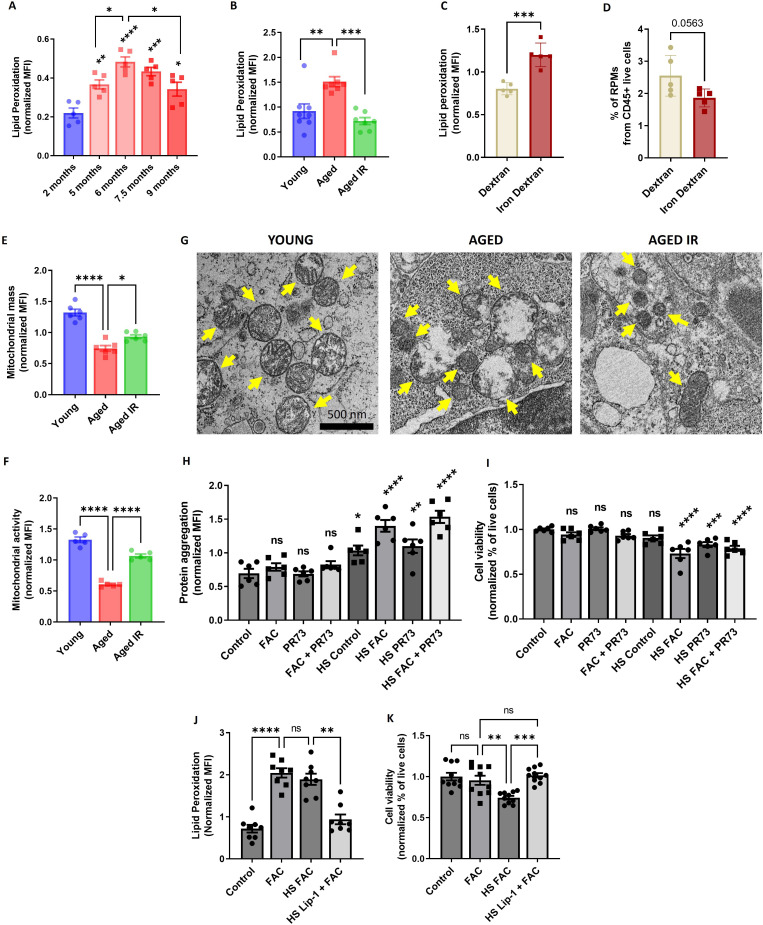
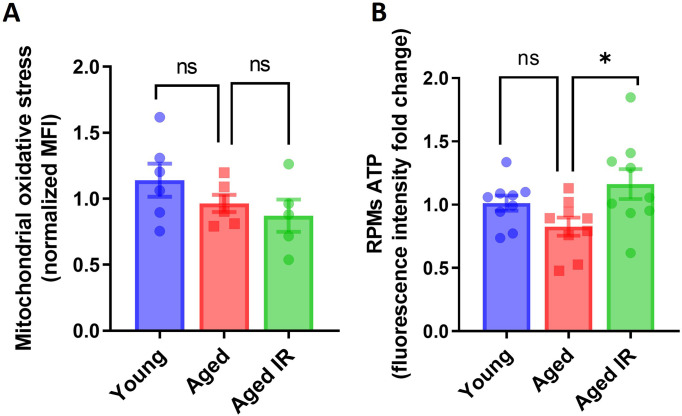
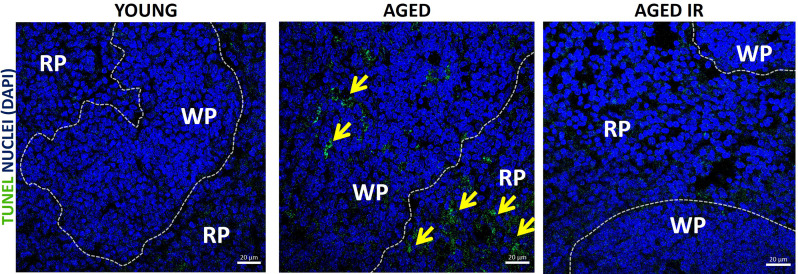
Figure 5. Aging triggers RPM loss via mechanisms that resemble ferroptosis and involve proteotoxicity.
(A) Lipid peroxidation was determined in RPMs derived from mice at the indicated age using the Lipid Peroxidation Assay Kit with flow cytometry. (B) Lipid peroxidation was determined in RPMs derived from young, aged, and aged IR mice using the Lipid Peroxidation Assay Kit with flow cytometry. (C) Lipid peroxidation was determined in RPMs derived from dextran- and iron-dextran-injected mice (8 hr post-injection) using the Lipid Peroxidation Assay Kit with flow cytometry. (D) The percentage of RPMs from CD45+ live cells present in the spleen of dextran- and iron dextran-injected mice (8 hr post-injection) was assessed by flow cytometry. (E) Mitochondrial mass and (F) mitochondrial activity were determined in RPMs derived from young, aged, and aged IR mice using MitoTracker Green and TMRE probes, respectively, with flow cytometry. (G) Ultrastructural analyses of mitochondrial morphology in spleen red pulp sections obtained from young, aged, and aged IR mice. Yellow arrows indicate mitochondria. (H) Protein aggregation and (I) cell viability in cultured iRPMs were determined using PROTEOSTAT Aggresome detection kit and a fluorescent Aqua Live/Dead probe, respectively, with flow cytometry. Cells were treated with FAC (150 µM, 24 hr), PR73 mini-hepcidin (2 µg/mL, 24 hr), or exposed to heat shock (HS) stress (42 °C, 4 hr) as indicated. (J) Lipid peroxidation and (K) cell viability of cultured iRPMs were determined using the Lipid Peroxidation Assay Kit and fluorescent Aqua Live/Dead probe, respectively, with flow cytometry. Cells were treated with FAC (150 µM, 24 hr), Liproxstatin-1 (Lip-1; 2 µM, 25 hr) or exposed to heat shock (HS) stress (42 °C, 4 hr) as indicated. Each dot represents one mouse or independent cell-based experiment. Data are represented as mean ± SEM. Welch’s unpaired t-test determined statistical significance between the two groups; statistical significance among the three or more groups was determined by One-Way ANOVA test with Dunnett’s or Tukey’s Multiple Comparison test. *p<0.05, **p<0.01, ***p<0.001 and ****p<0.0001.


