. 2023 Jan 31;12:e79196. doi: 10.7554/eLife.79196

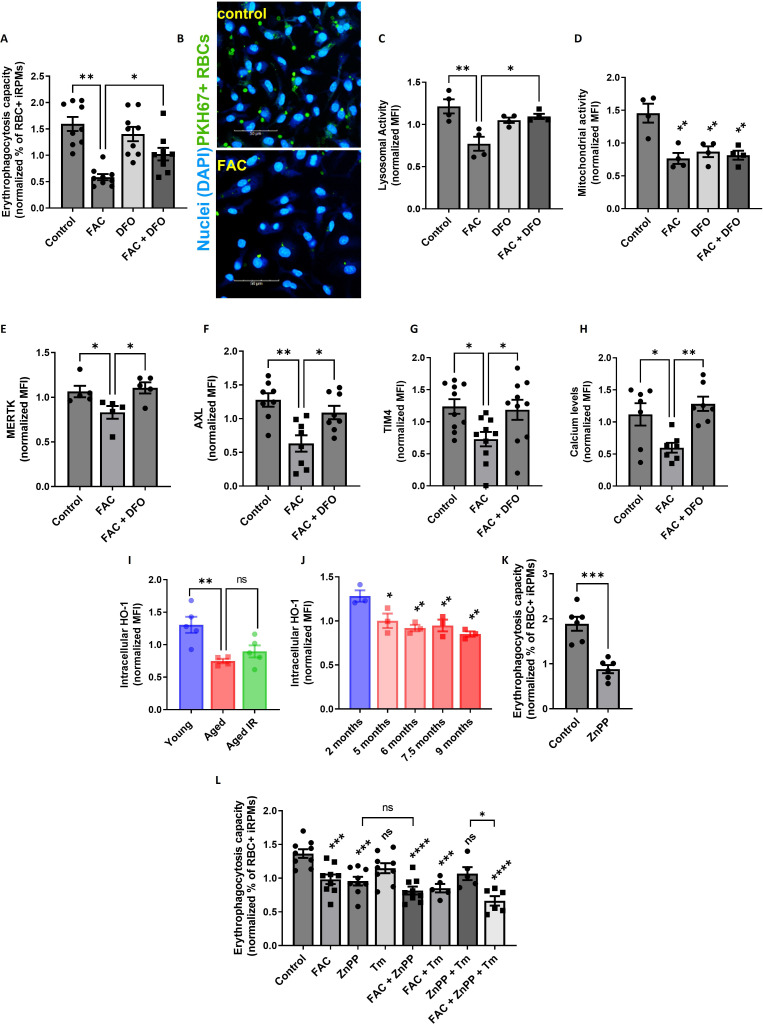
Figure 6. Iron loading undermines the phagocytic activity of iRPMs in concert with impaired heme metabolism and ER stress.

(A) Normalized erythrophagocytosis capacity of PKH67-labeled temperature-stressed RBCs by cultured iRPMs. Cells were treated with FAC (50 µM, 24 hr) and DFO (100 µM, 18 hr) as indicated. (B) Representative confocal microscopy images of erythrophagocytosis in FAC-treated iRPMs compared with control cells. (C) Lysosomal and (D) mitochondrial activity of cultured iRPMs were determined using Lysosomal Intracellular Activity Assay Kit and TMRE probe, respectively, with flow cytometry. Cells were treated with FAC (50 µM, 24 hr) and DFO (100 µM, 18 hr) as indicated. (E) Cell membrane expression levels of MERTK, (F) AXL and (G) TIM4 of cultured iRPMs were determined by using fluorescently labeled antibodies and flow cytometry. Cells were treated with FAC (50 µM, 24 hr) and DFO (100 µM, 18 hr) as indicated. (H) Cytosolic calcium levels of cultured iRPMs were determined using Cal-520 fluorescent probe with flow cytometry. Cells were treated with FAC (50 µM, 24 hr) and DFO (100 µM, 18 hr) as indicated. (I) Intracellular HO-1 protein levels in RPMs isolated from young, aged, and aged IR mice were measured by flow cytometry. (J) Intracellular HO-1 protein levels in RPMs isolated from mice at the indicated age were measured by flow cytometry. (K) Normalized erythrophagocytosis capacity of PKH67-labeled temperature-stressed RBCs by cultured iRPMs. Cells were treated with ZnPP (0.5 µM, 24 hr). (L) Normalized erythrophagocytosis capacity of PKH67-labeled temperature-stressed RBCs by cultured iRPMs. Cells were treated with indicated concentrations of ZnPP (0.5 µM) and FAC (10 µM) and with ER stress inducer Tunicamycin (Tm; 2.5 µM) for 24 hr. Each dot represents one mouse or independent cell-based experiment. Data are represented as mean ± SEM. Statistical significance among the three or more groups was determined by One-Way ANOVA test with Dunnett’s or Tukey’s Multiple Comparison test. *p<0.05, **p<0.01, ***p<0.001 and ****p<0.0001.

Figure 6—source data 1. Related to Figure 6A and C–L.

Figure 6.

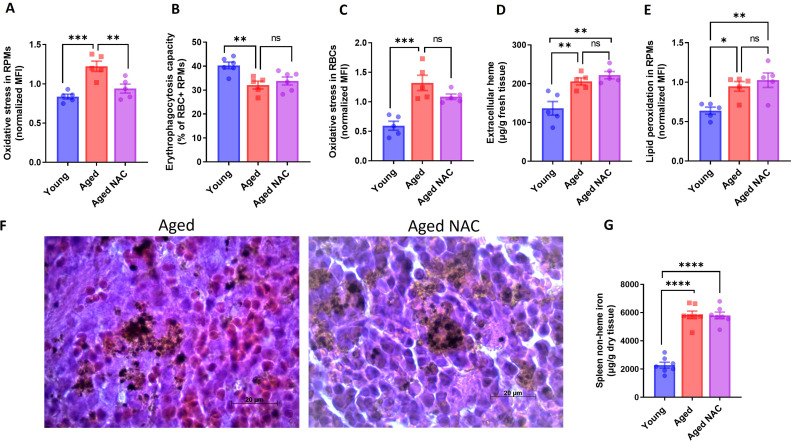
Figure 6—figure supplement 1. Iron loading, but not oxidative stress leads to RPM decline during aging.

Figure 6—figure supplement 1.

(A) The cytosolic ROS levels in RPMs derived from young, aged, and aged NAC were assessed by determining CellROX Deep Red fluorescence intensity with flow cytometry. (B) RBC clearance capacity of RPMs derived from young, aged, and aged NAC mice was determined by measuring the percentage of RPMs that phagocytosed transfused PKH67-labeled temperature-stressed RBCs. (C) The cytosolic ROS levels in RBCs derived from the spleen of young, aged, and aged NAC mice were assessed by determining CellROX Deep Red fluorescence intensity with flow cytometry. (D) Extracellular heme levels were measured in the supernatant obtained after the dissociation of spleens from young, aged, and aged NAC mice using the Heme Assay Kit. (E) Lipid peroxidation was determined in RPMs derived from young, aged, and aged NAC mice using the Lipid Peroxidation Assay Kit with flow cytometry. (F) Hematoxylin and eosin staining of the splenic red pulp in young, aged, and aged IR mice. (G) Spleen non-heme iron content was determined in young, aged, and aged NAC mice. Each dot represents one mouse. Data are represented as mean ± SEM. Statistical significance among the three groups was determined by the One-Way ANOVA test with Tukey’s Multiple Comparison test. ns p>0.05, *p<0.05, **p<0.01, ***p<0.001 and ****p<0.0001.
Figure 6—figure supplement 1—source data 1. Related to Figure 6—figure supplement 1A–E and G.
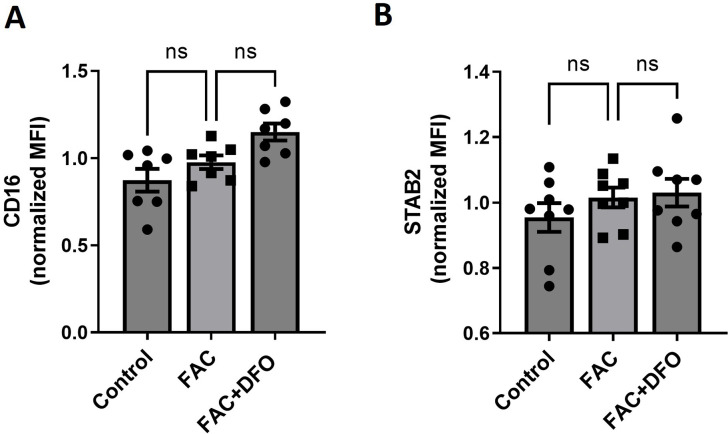
Figure 6—figure supplement 2. The Fc receptor CD16 and the apoptotic cell receptor STAB2 are not regulated by iron-loading.

Figure 6—figure supplement 2.

(A) Cell membrane expression levels of CD16 and (B) STAB2 in iRPMs were determined by using fluorescently labeled antibodies and flow cytometry. Cells were treated with FAC (50 µM, 24 hr) with or without the addition of DFO (100 µM, 18 hr) as indicated. Each dot represents one independent cell-based experiment. Data are represented as mean ± SEM. Statistical significance among the three groups was determined by the One-Way ANOVA test with Tukey’s Multiple Comparison test. ns p>0.05.
Figure 6—figure supplement 2—source data 1. Related to Figure 6—figure supplement 2A–B.
Figure 6—figure supplement 3. Validation of the antibody against HO-1 in flow cytometry.
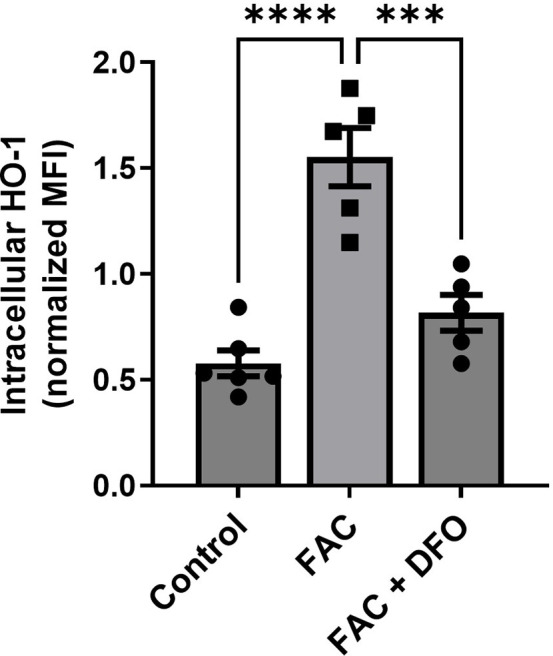
Figure 6—figure supplement 3.

Shown is the intracellular staining and flow cytometric analysis of HO-1 in bone-marrow-derived macrophages treated with ferric ammonium citrate (FAC, 50 µM, 24 hr) and iron chelator DFO (100 µM, 18 hr). Expected changes in fluorescence intensity were observed. Each dot represents one independent cell-based experiment. Data are represented as mean ± SEM. Statistical significance among the three groups was determined by the One-Way ANOVA test with Tukey’s Multiple Comparison test. ***p<0.001 and ****p<0.0001.
Figure 6—figure supplement 3—source data 1. Related to Figure 6—figure supplement 3.
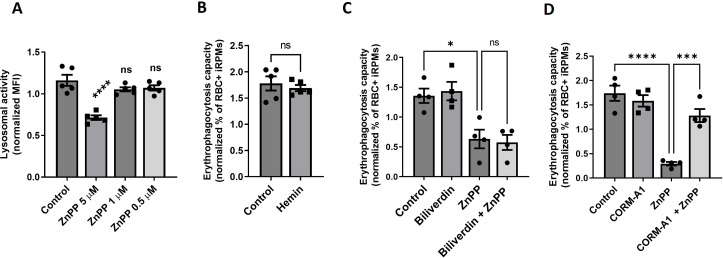
Figure 6—figure supplement 4. The effects of HO-1 inhibition on lysosomal activity and HO-1 co-products on the erythrophagocytosis capacity of iRPMs.

Figure 6—figure supplement 4.

(A) Lysosomal activity of cultured iRPMs was determined using Lysosomal Intracellular Activity Assay Kit with flow cytometry. Cells were treated with ZnPP in 5 µM, 1 µM, and 0.5 µM concentrations for 24 hr. (B–D) Normalized erythrophagocytosis capacity of PKH67-labeled temperature-stressed RBCs by cultured iRPMs. Cells were treated with (B) hemin (50 µM, 24 hr), (C–D) ZnPP (5 µM, 24 hr) and (C) Biliverdin (50 µM, 24 hr) or (D) the CO donor CORM-A1 (50 µM, 24 hr) as indicated. Each dot represents one independent cell-based experiment. Data are represented as mean ± SEM. Statistical significance among the four groups was determined by One-Way ANOVA test with Dunnett’s or Tukey’s Multiple Comparison test; Welch’s unpaired t-test determined statistical significance between the two groups. ns p>0.05, *p<0.05, ***p<0.001 and ****p<0.0001.
Figure 6—figure supplement 4—source data 1. Related to Figure 6—figure supplement 4A–D.