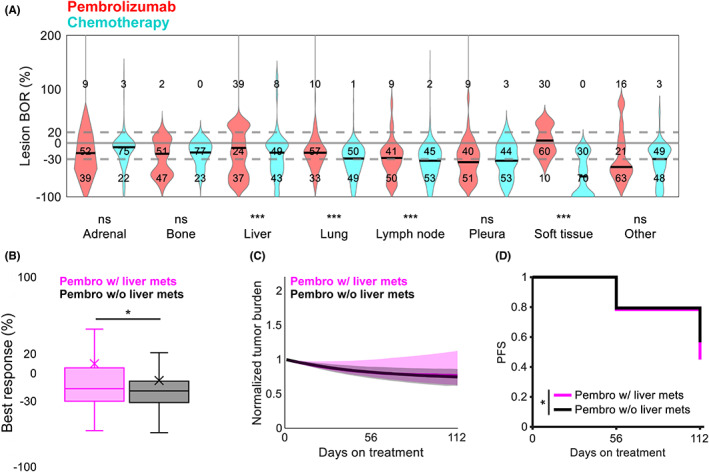
FIGURE 3.

Responses to virtual monotherapy vary across anatomical sites. (a) Lesion‐level BORs under chemotherapy (cyan) and pembrolizumab (red) by anatomical location. Numbers indicate the proportion (%) of lesions with diameter changes under treatment that were ≥20%, −30% to 20%, and ≤−30%. Gray lines indicate cutoffs for 20% and −30%; solid black lines indicate medians. ***p < 0.001 (unpaired Student t test). (b) Best patient‐level reduction in tumor burden under pembrolizumab in patients with (pink) and without (black) baseline liver metastases. X, mean; *p < 0.05 (unpaired Student t test). (c) Median tumor burden under pembrolizumab in patients with (pink) and without (black) baseline liver metastases. Shaded regions represent the interquartile range at each timepoint. (d) PFS under pembrolizumab in patients with (pink) and without (black) baseline liver metastases. *p < 0.05 (log‐rank test). BOR, best objective response; Ns, not significant; PFS, progression‐free survival
