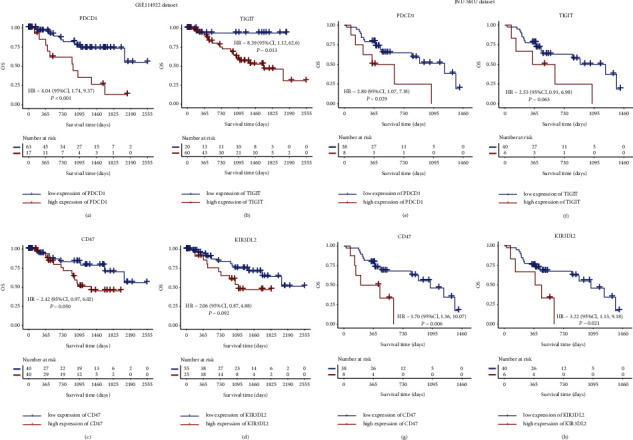
Figure 2.

OS analysis of PDCD1, TIGIT, CD47, and KIR3DL2 for MDS patients. High expression of PDCD1, TIGIT, CD47, and KIR3DL2 was associated with poor OS. Kaplan–Meier curves were plotted according to groups of high and low expression of PDCD1 (a), TIGIT (b), CD47 (c), and KIR3DL2 (d) in the GSE114922 dataset (n = 80). OS analysis of PDCD1 (e), TIGIT (f), CD47 (g), and KIR3DL2 (h) in the JNU-SMU dataset (n = 46).
