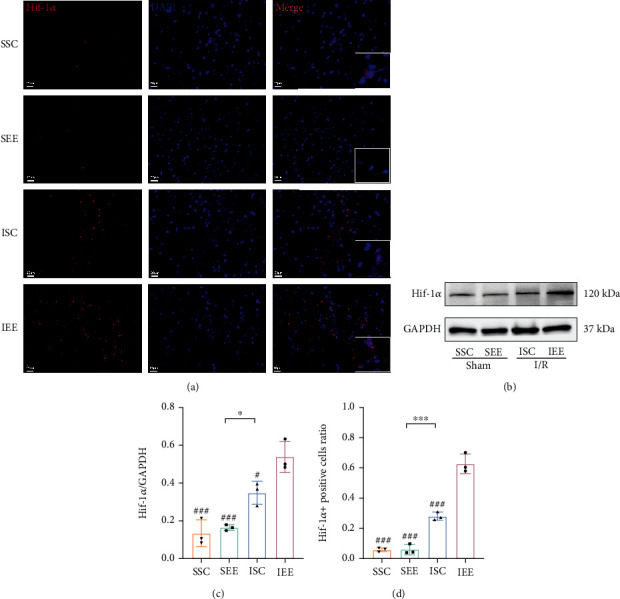
Figure 7.

Enriched environment increased the expression of HIF-1α after I/R injury. (a, d) Immunofluorescence images of HIF-1α and statistical analysis of the positive rate. (b, c) Western blots and quantification of HIF-1α in the peri-infarct cortex. Scale bars, 20 μm. n = 3. Data are expressed as mean ± SD. ∗p < 0.05 and ∗∗∗p < 0.001 vs. SEE group; #p < 0.05 and ###p < 0.001 vs. IEE group.
