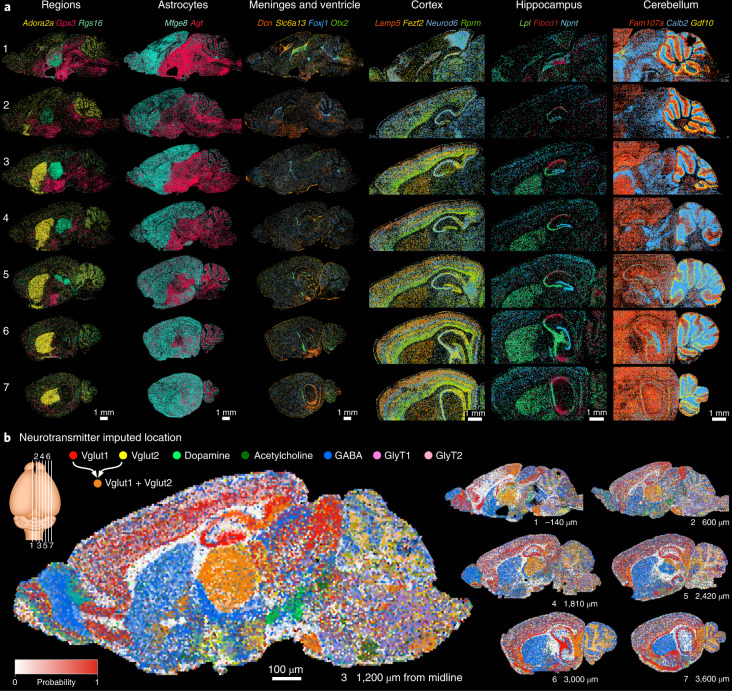
Fig. 5. Mouse brain atlas of seven sagittal sections.
a, Raw RNA signals for selected markers to highlight various anatomical structures. From left to right: markers for striatum (Adora2a), hypothalamus (Gpx3) and thalamus (Rgs16); Mfge8 labels telencephalic astrocytes, whereas Agt labels nontelencephalic astrocytes; markers for meninges (Dcn, Slc6a13), ependymal (Foxj1) and choroid plexus epithelium (Otx2); layers of the cortex; hippocampal CA1 (Fibcd1), CA3 (Lpl) and dentate gyrus (Npnt); cerebellar Bergman glia cell body (Gdf10), processes (Fam107a) and granule cells (Calb2). b, Probabilities of neurotransmitter location by imputing single-cell RNA-seq data with the spatial mouse atlas show neurotransmitter domains. Intensity reflects the probability of neurotransmitter identity, and colors are proportionally mixed where neurotransmitters overlap.

