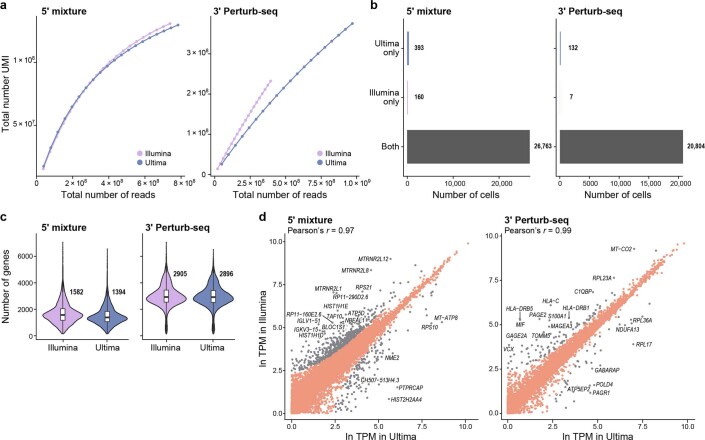
Extended Data Fig. 6. Quality metrics for libraries from a mixture of PBMCs (5′) and from Perturb-Seq (3′).
(a) The total number of UMIs detected per cell at different sequencing depths. (b) The number of cells found by Cell Ranger only in Ultima, only in Illumina, or in both. (c) Distribution of the number of genes per cell. (d) Scatter plots with one point for each gene as in Fig. 2e. For the 3′ library, the last three UMI bases were trimmed for quality reasons. For panels (b) to (d), reads sampled to have the same number of UMIs for Illumina and Ultima for 3′ libraries, but sampling not needed as already nearly the same for 5′ libraries.

