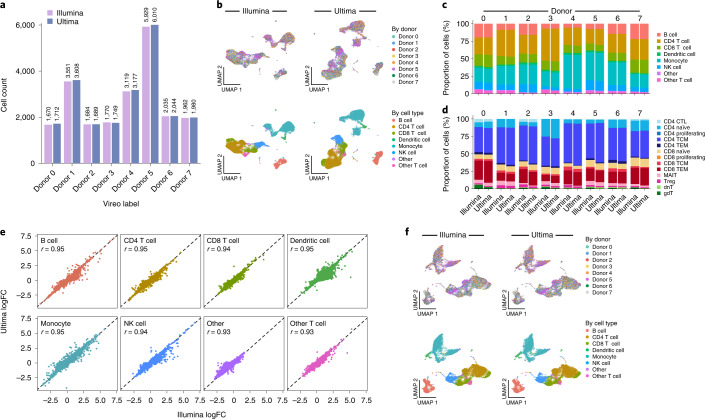
Fig. 3. Cell-type identification and characterization of a mixture of PBMCs.
a, Number of cells assigned to each donor by Vireo. Donors were renamed to match between Ultima and Illumina. b, UMAP plots for Ultima (right) and Illumina (left) colored by donor (top) and cell type (bottom). c, Bar plots of the proportion of each Azimuth-defined cell type in each donor for Ultima and Illumina. d, Bar plots of the proportion of each Azimuth-defined T cell subtype in each donor for Ultima and Illumina. Strong agreement can be seen. e, Scatter plots of logFC from performing DE between cell-type clusters with Presto. f, Joint UMAP of Ultima and Illumina data colored as in b. We did not sample the exact same number of reads from Illumina or Ultima data since they have approximately the same number of total UMIs. NK, natural killer cells; CTL, cytotoxic T cells; TCM, central memory T cells; MAIT, mucosal-associated invariant T cells; Treg, regulatory T cells; dnT, double negative T cells; gdT, gamma delta T cells.

