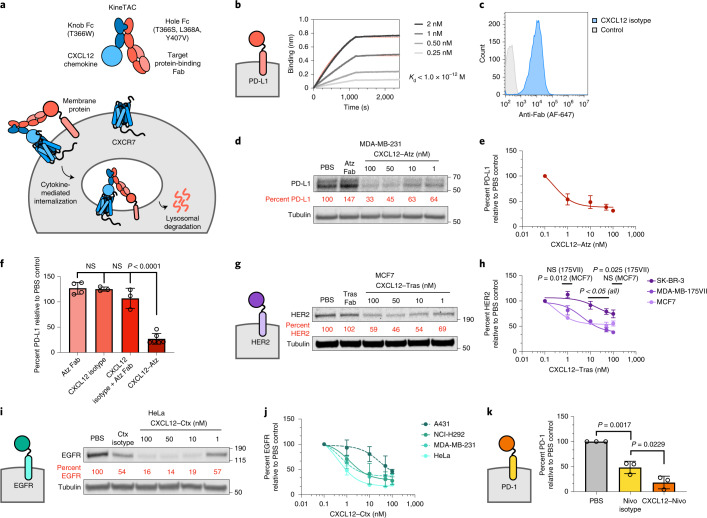
Fig. 1. KineTAC platform for targeted protein degradation of therapeutically relevant cell surface proteins.
a, Schematic of the KineTAC concept for targeting cell surface proteins for lysosomal degradation via CXCL12-mediated endocytosis. b, Multipoint BLI measurement of CXCL12–Atz shows high affinity to PD-L1 Fc fusion. c, Flow cytometry showing CXCL12 isotype binding on MDA-MB-231 cells endogenously expressing CXCR7. d–e, Dose escalation experiment showing PD-L1 degradation in MDA-MB-231 cells after 24 h of treatment with CXCL12–Atz; n = 3 biologically independent experiments. f, PD-L1 levels were significantly reduced after a 24-h treatment of MDA-MB-231 cells with 100 nM CXCL12–Atz (P < 0.0001) compared to Atz Fab alone but not with CXCL12 isotype (P = 0.1946) or a combination of Atz Fab and CXCL12 isotype (P = 0.8262); n = 4, 3, 3 or 6 biologically independent experiments, respectively; NS, not significant. g, Dose escalation experiment showing HER2 degradation in MCF7 cells after 24-h treatment with CXCL12–Tras or 100 nM Tras Fab. h, Summary of HER2 degradation in various HER2-expressing cell lines following 24-h treatment with CXCL12–Tras. Data show significantly greater HER2 degradation in MDA-MB-175VII (P = 0.0248) than for SK-BR-3 cells, but not for MCF7 (P = 0.1003); n = 2 biologically independent experiments. i, Dose escalation showing EGFR degradation in HeLa cells after 24-h treatment with CXCL12–Ctx or 100 nM Ctx isotype. j, Summary of EGFR degradation in various EGFR-expressing cell lines following 24-h treatment with CXCL12–Ctx; n = 2 biologically independent experiments for A431, NCI-H292 and MDA-MB-231 cells, and n = 3 biologically independent experiments for HeLa cells. k, Summary of flow cytometry data demonstrating significant degradation of cell surface PD-1 on activated primary human CD8+ T cells after treatment with 100 nM CXCL12–Nivo compared to treatment with Nivo isotype (P = 0.0229). Percent PD-1 was determined by median fluorescence intensity (MFI) of the PE fluorescence channel of live cells; n = 10,000 live cells analyzed over three biologically independent experiments. Densitometry was used to calculate protein levels, and data were normalized to PBS control. Data are represented as mean values, and error bars represent the standard deviation of biological replicates. P values were determined by one-way analysis of variance (ANOVA) with Sidak’s multiple comparisons test.

